**NOTE: NOW FEATURING POST-AUCTION ANALYSIS.**
(Clock Auction Analysis Now Found Below Post-Auction Analysis)
(Clock Auction Analysis Now Found Below Post-Auction Analysis)
POST-AUCTION ANALYSIS FOR AUCTION 110 (3450-3550 MHz Band)
Total Proceeds at End of Assignment Stage:
| Gross Proceeds | Net Proceeds | |
| All Categories: | $22,513,601,811 | $22,418,284,236 |
| Category 1: | $21,127,398,141 | $21,032,080,566 |
| Category 2: | $1,386,203,670 | $1,386,203,670 |
Nationwide Price Per MHz-POP Statistics at End of Assignment Stage:
| Gross Price Per MHz-POP | Gross Price Per MHz-POP (Using 2020 POPs) | Net Price Per MHz-POP (1) | Net Price Per MHz-POP (Using 2020 POPs) (1) | |
| Average Across All Categories: | $0.736093 | $0.685469 | $0.732977 | $0.682567 |
| Category 1: | $0.736666 | $0.685234 | $0.733343 | $0.682142 |
| Category 2: | $0.727463 | $0.689079 | $0.727463 | $0.689079 |
(1) Net prices account for bidding credits awarded to small businesses and rural service providers.
POST-AUCTION ANALYSIS: Breakdown of Winning Bidders Across All Blocks(2)
(2) For those not familiar with these bidding entities, "Cellco Partnership" is Verizon and "Weminuche L.L.C." is DISH. Three Forty-Five Spectrum, LLC, NewLevel III, L.P., Whitewater Wireless II, L.P. and Cherry Wireless, LLC are among those that are backed by private equity firms.
POST-AUCTION ANALYSIS: Bidder Summary(3)
| Bidder | # of Markets Covered | # of Licenses Won | Ave. Depth | Weighted Ave. Depth | Pops Covered | % of CONUS Covered | Gross Payments | Net Payments | Gross $/MHz-POP | Net $/MHz-POP |
|---|---|---|---|---|---|---|---|---|---|---|
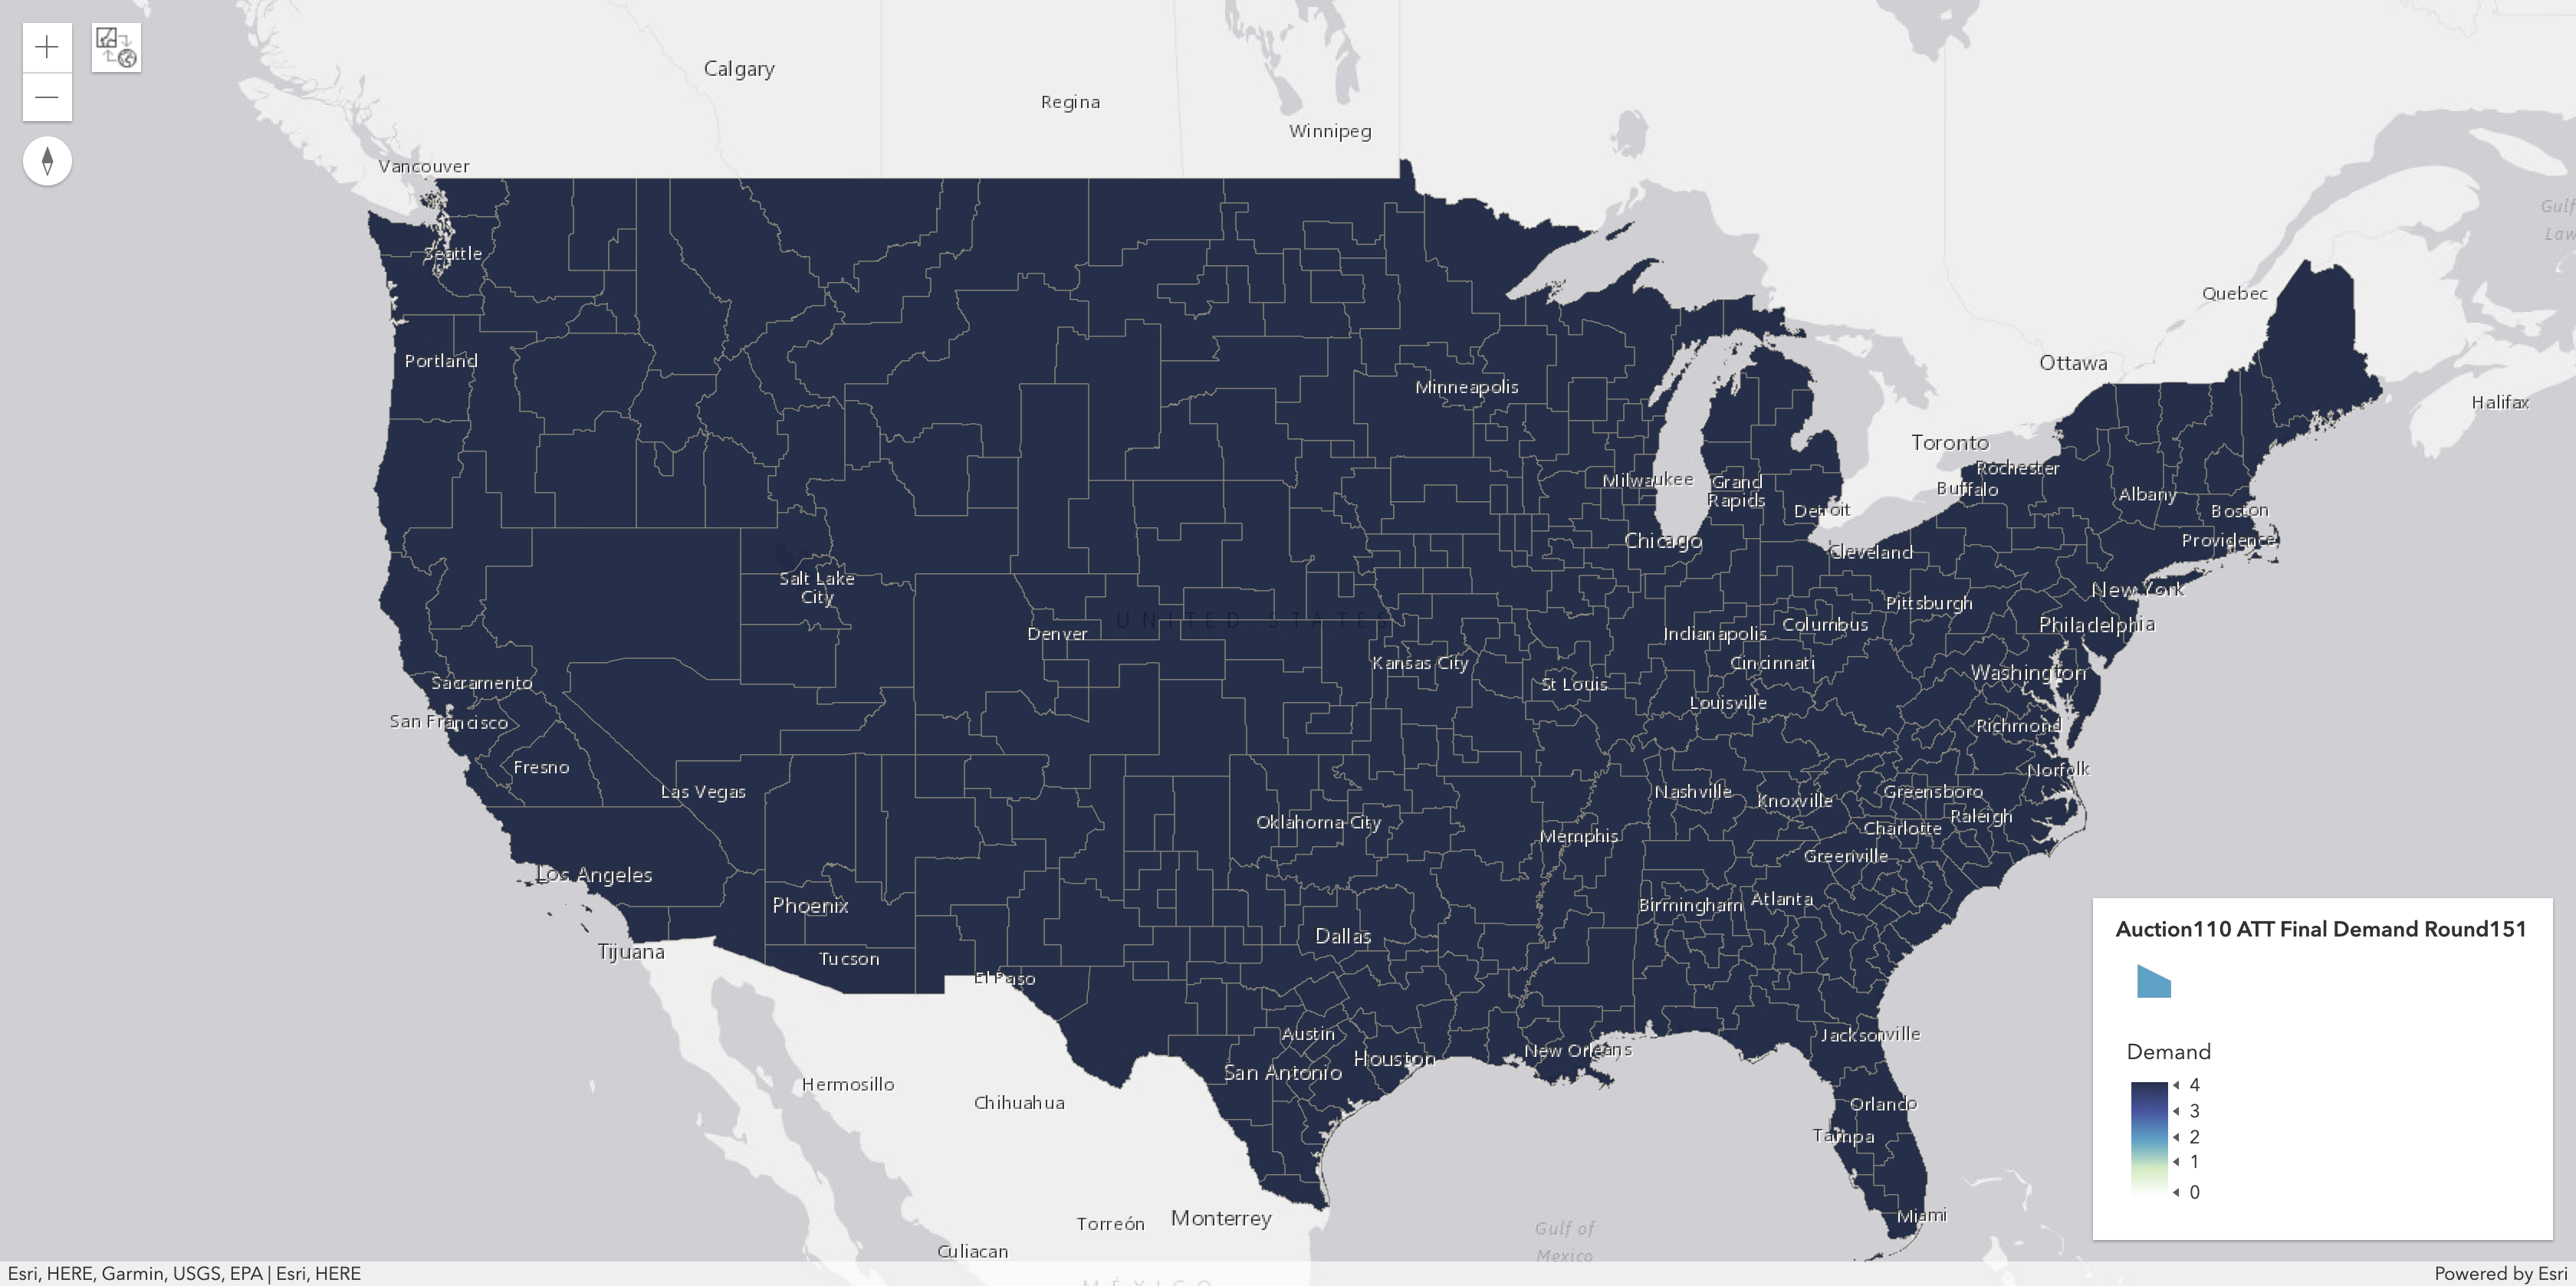
| AT&T Auction Holdings, LLC | 406 | 1,624 | 4.00 | 4.00 | 306,675,006 | 100.00% | $9,079,177,491 | $9,079,177,491 | $0.740130 | $0.740130 |
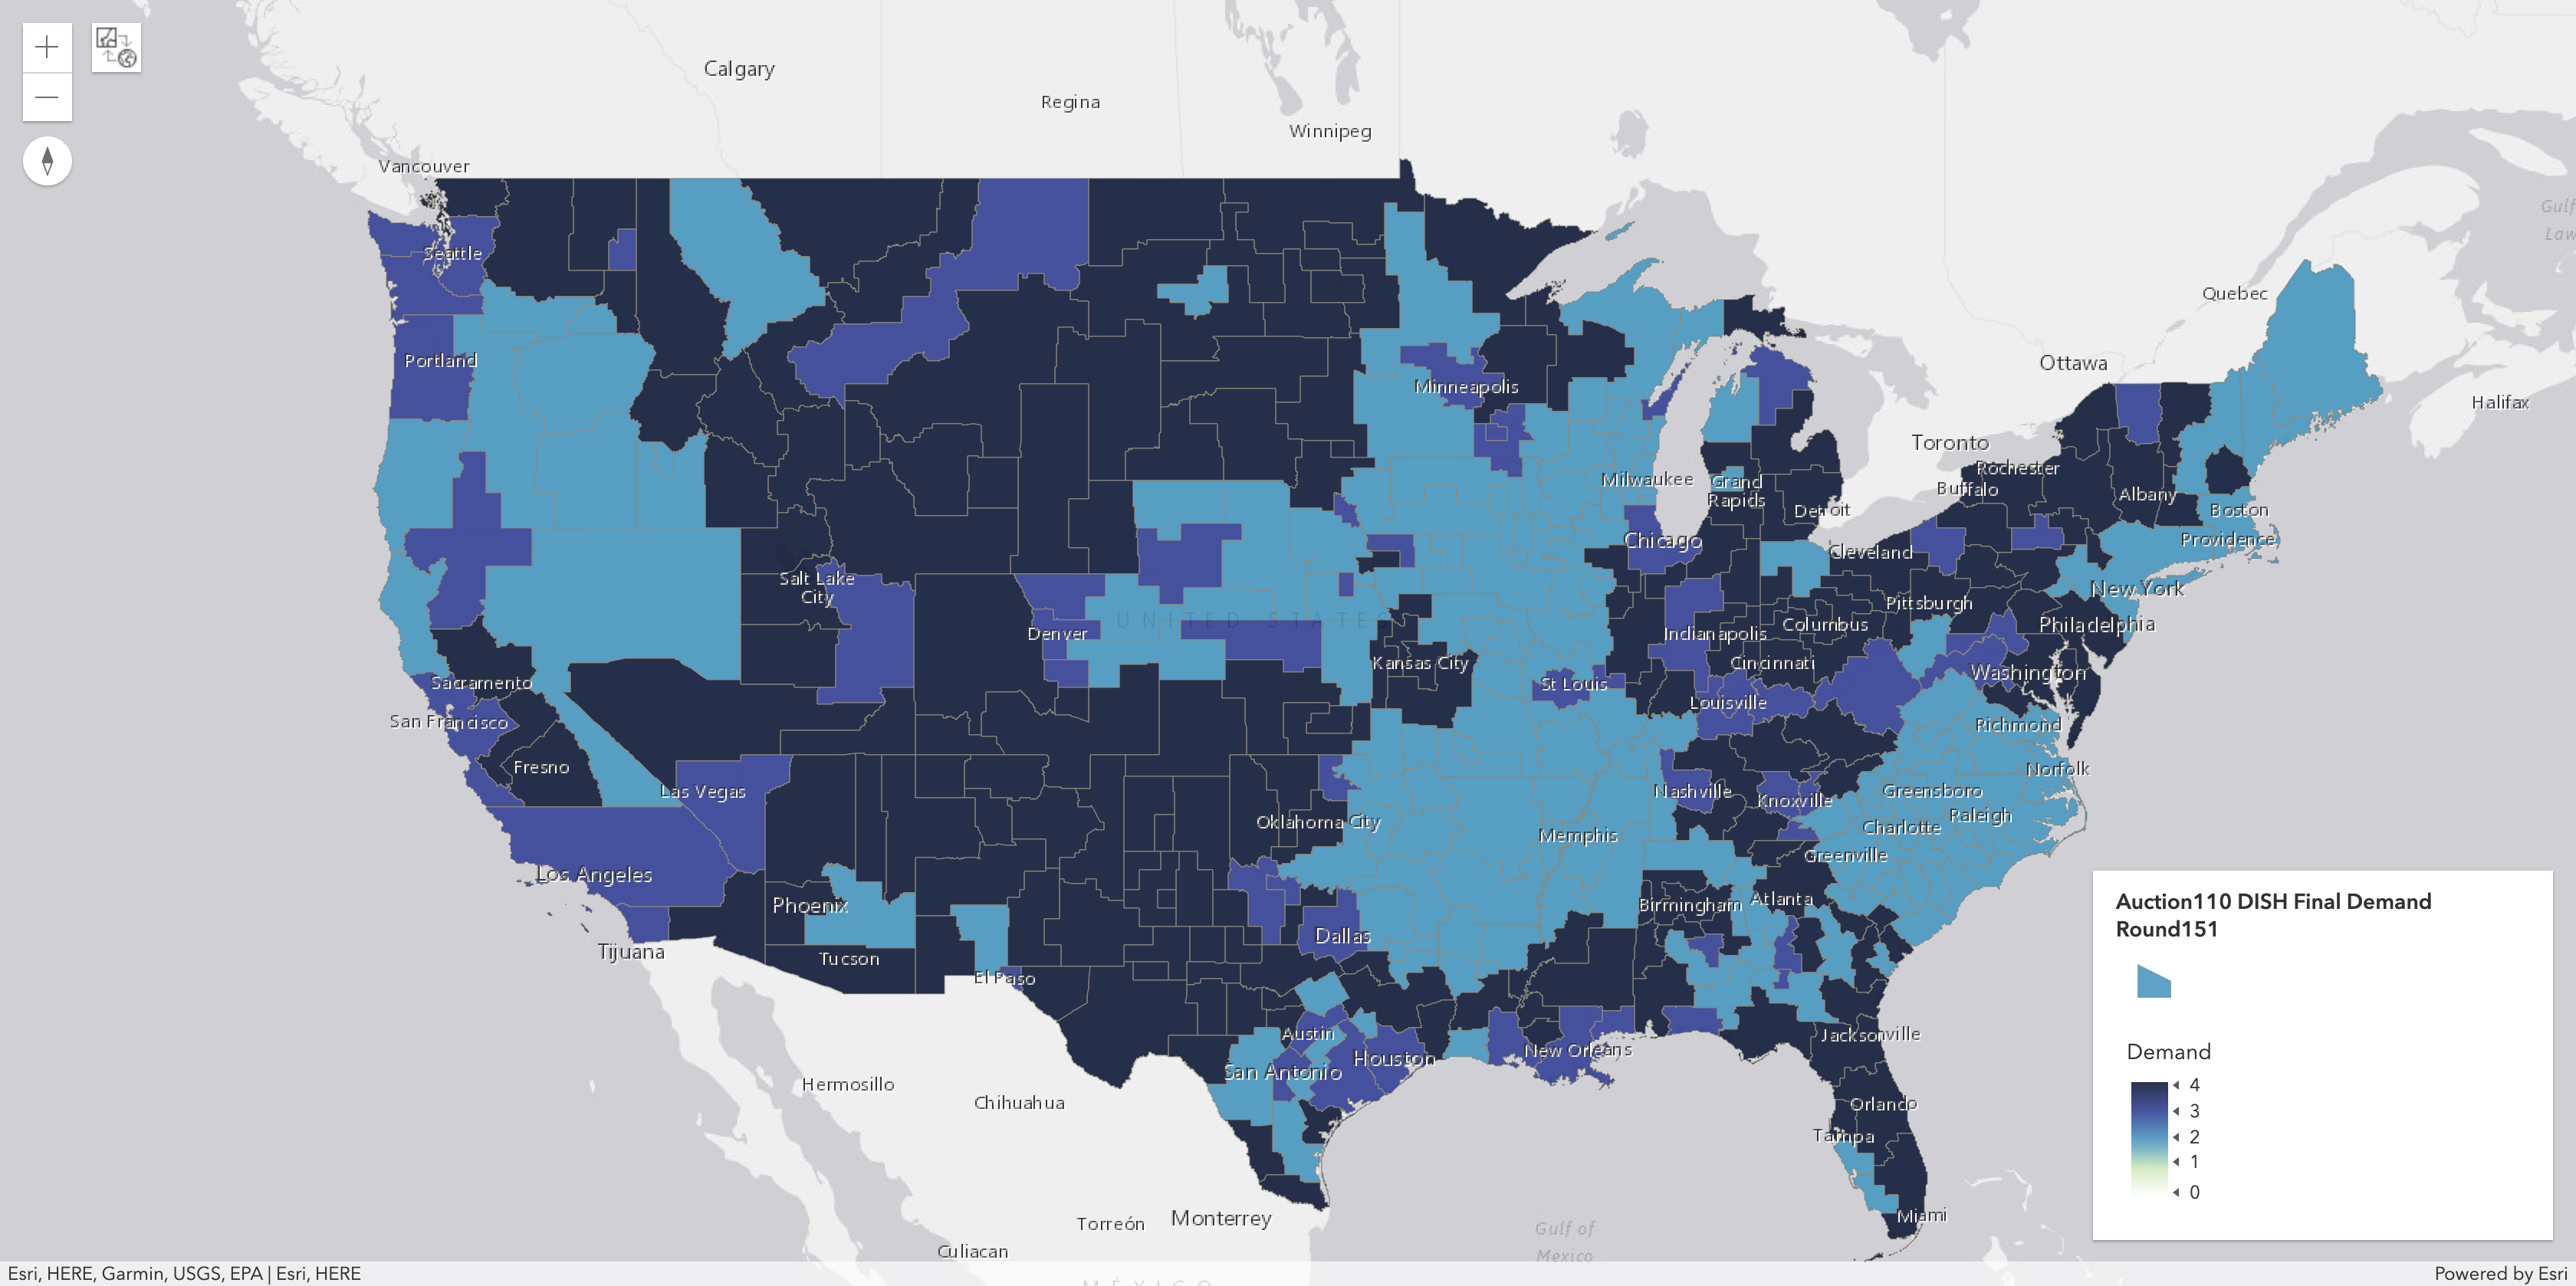
| Weminuche L.L.C. | 406 | 1,232 | 3.03 | 3.09 | 306,675,006 | 100.00% | $7,327,989,290 | $7,327,989,290 | $0.773753 | $0.773753 |
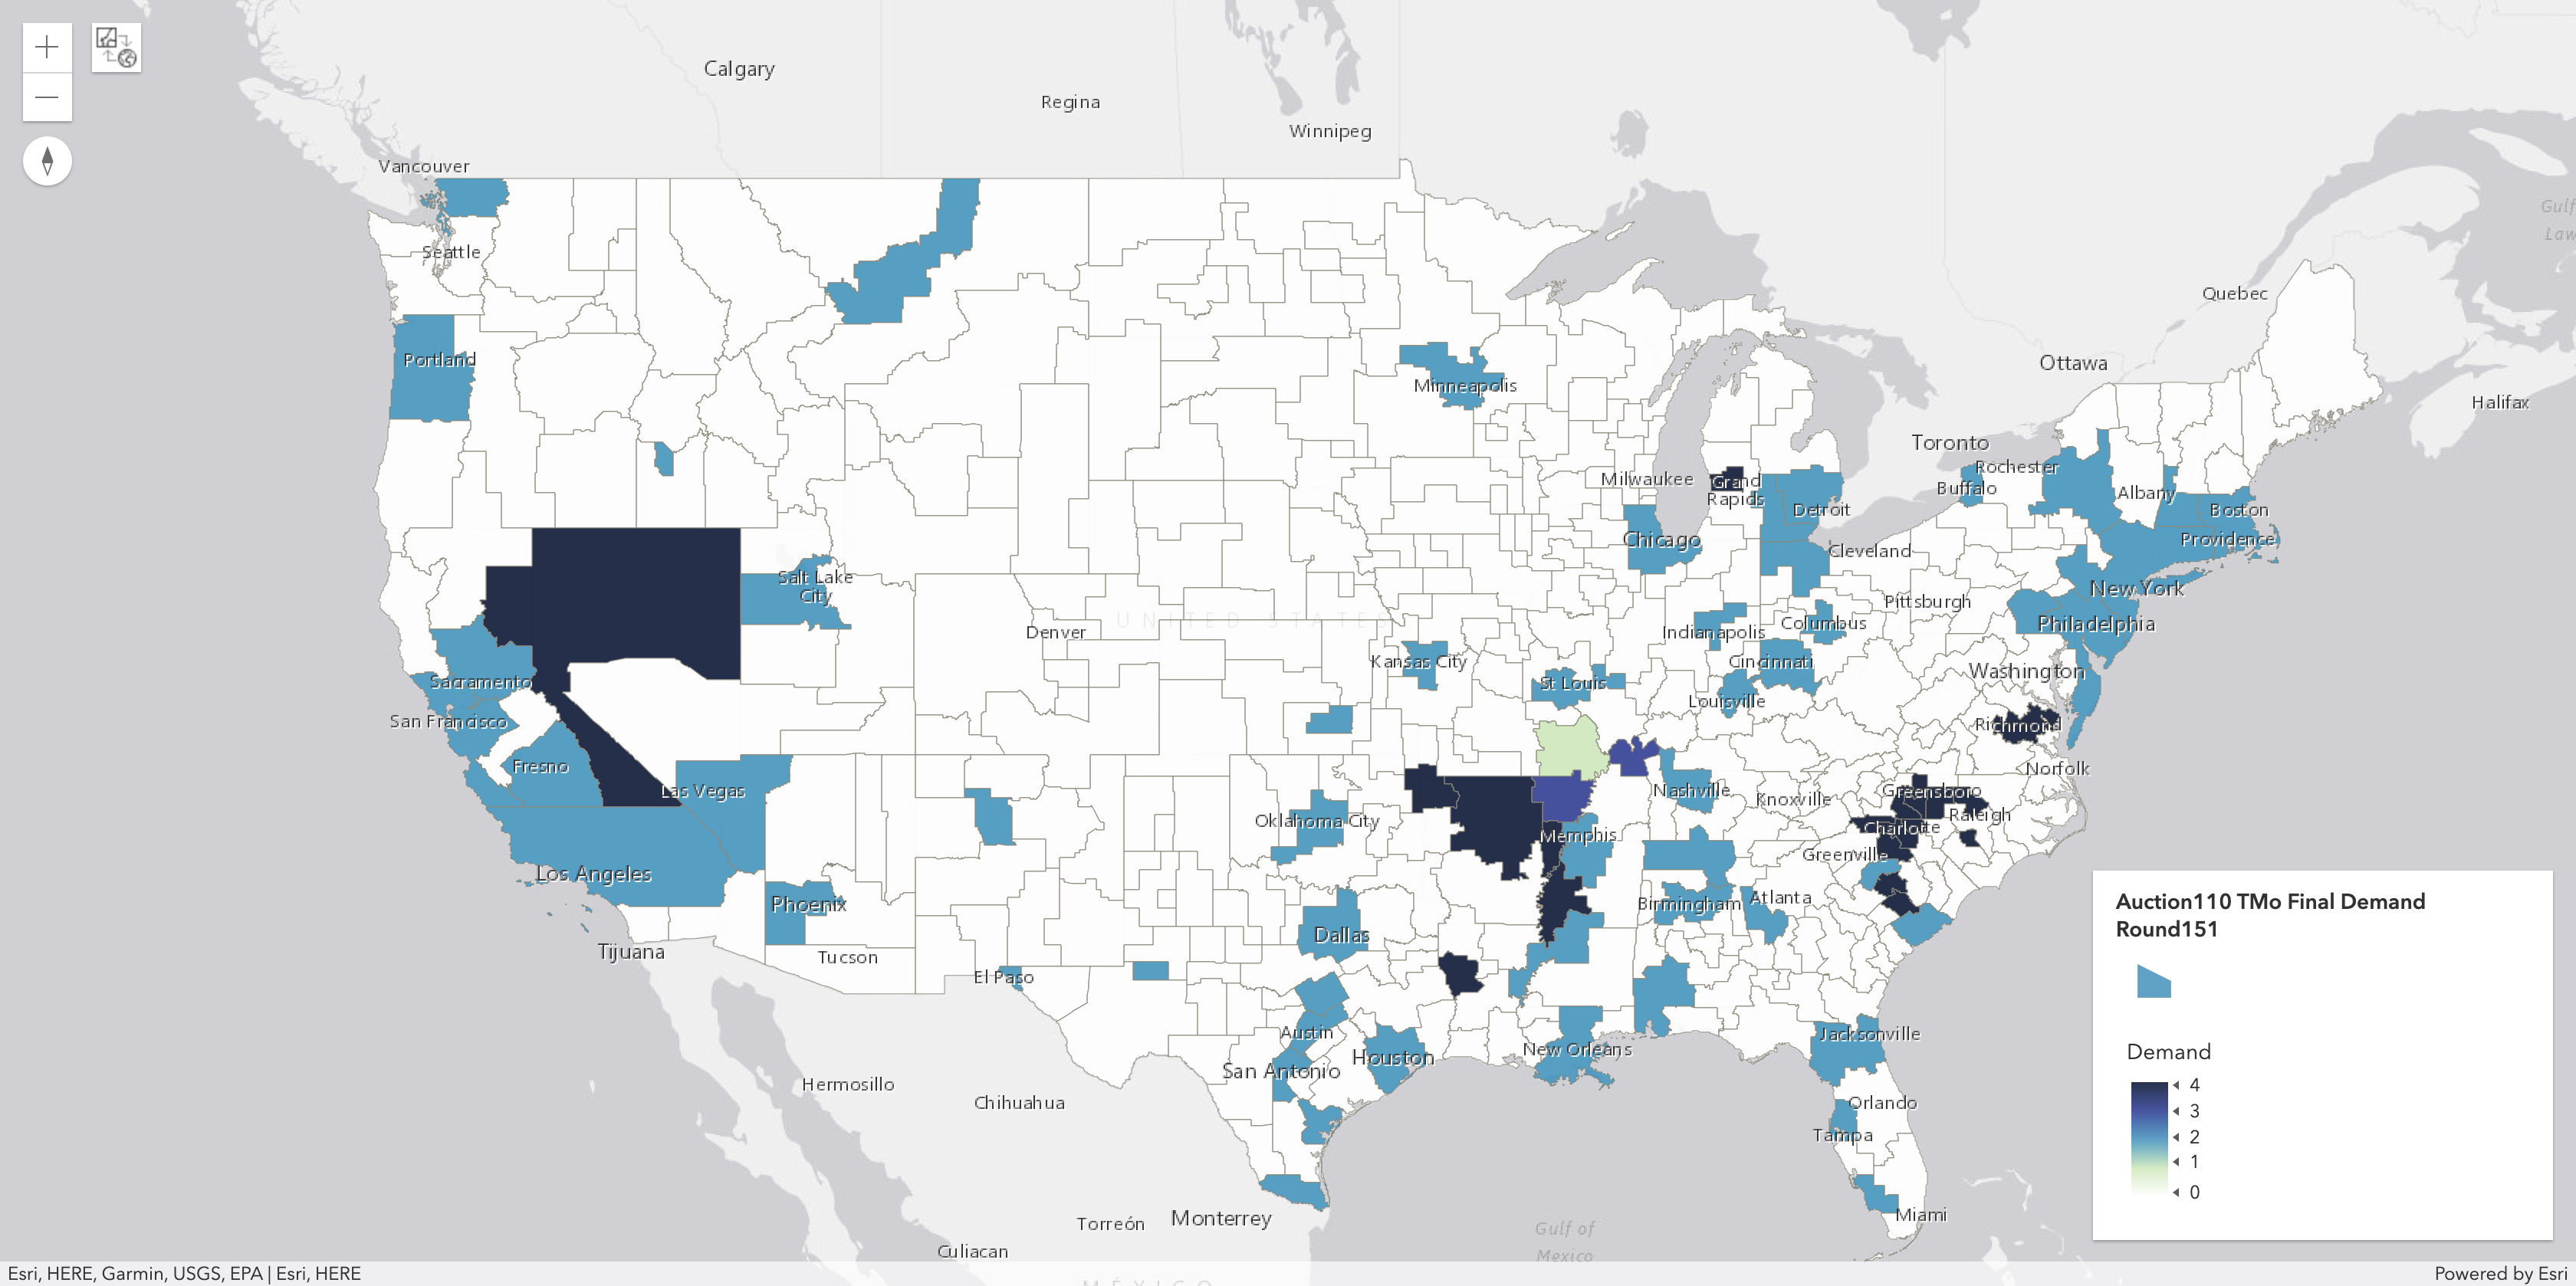
| T-Mobile License LLC | 79 | 199 | 2.52 | 2.13 | 170,035,598 | 55.44% | $2,898,418,995 | $2,898,418,995 | $0.799255 | $0.799255 |
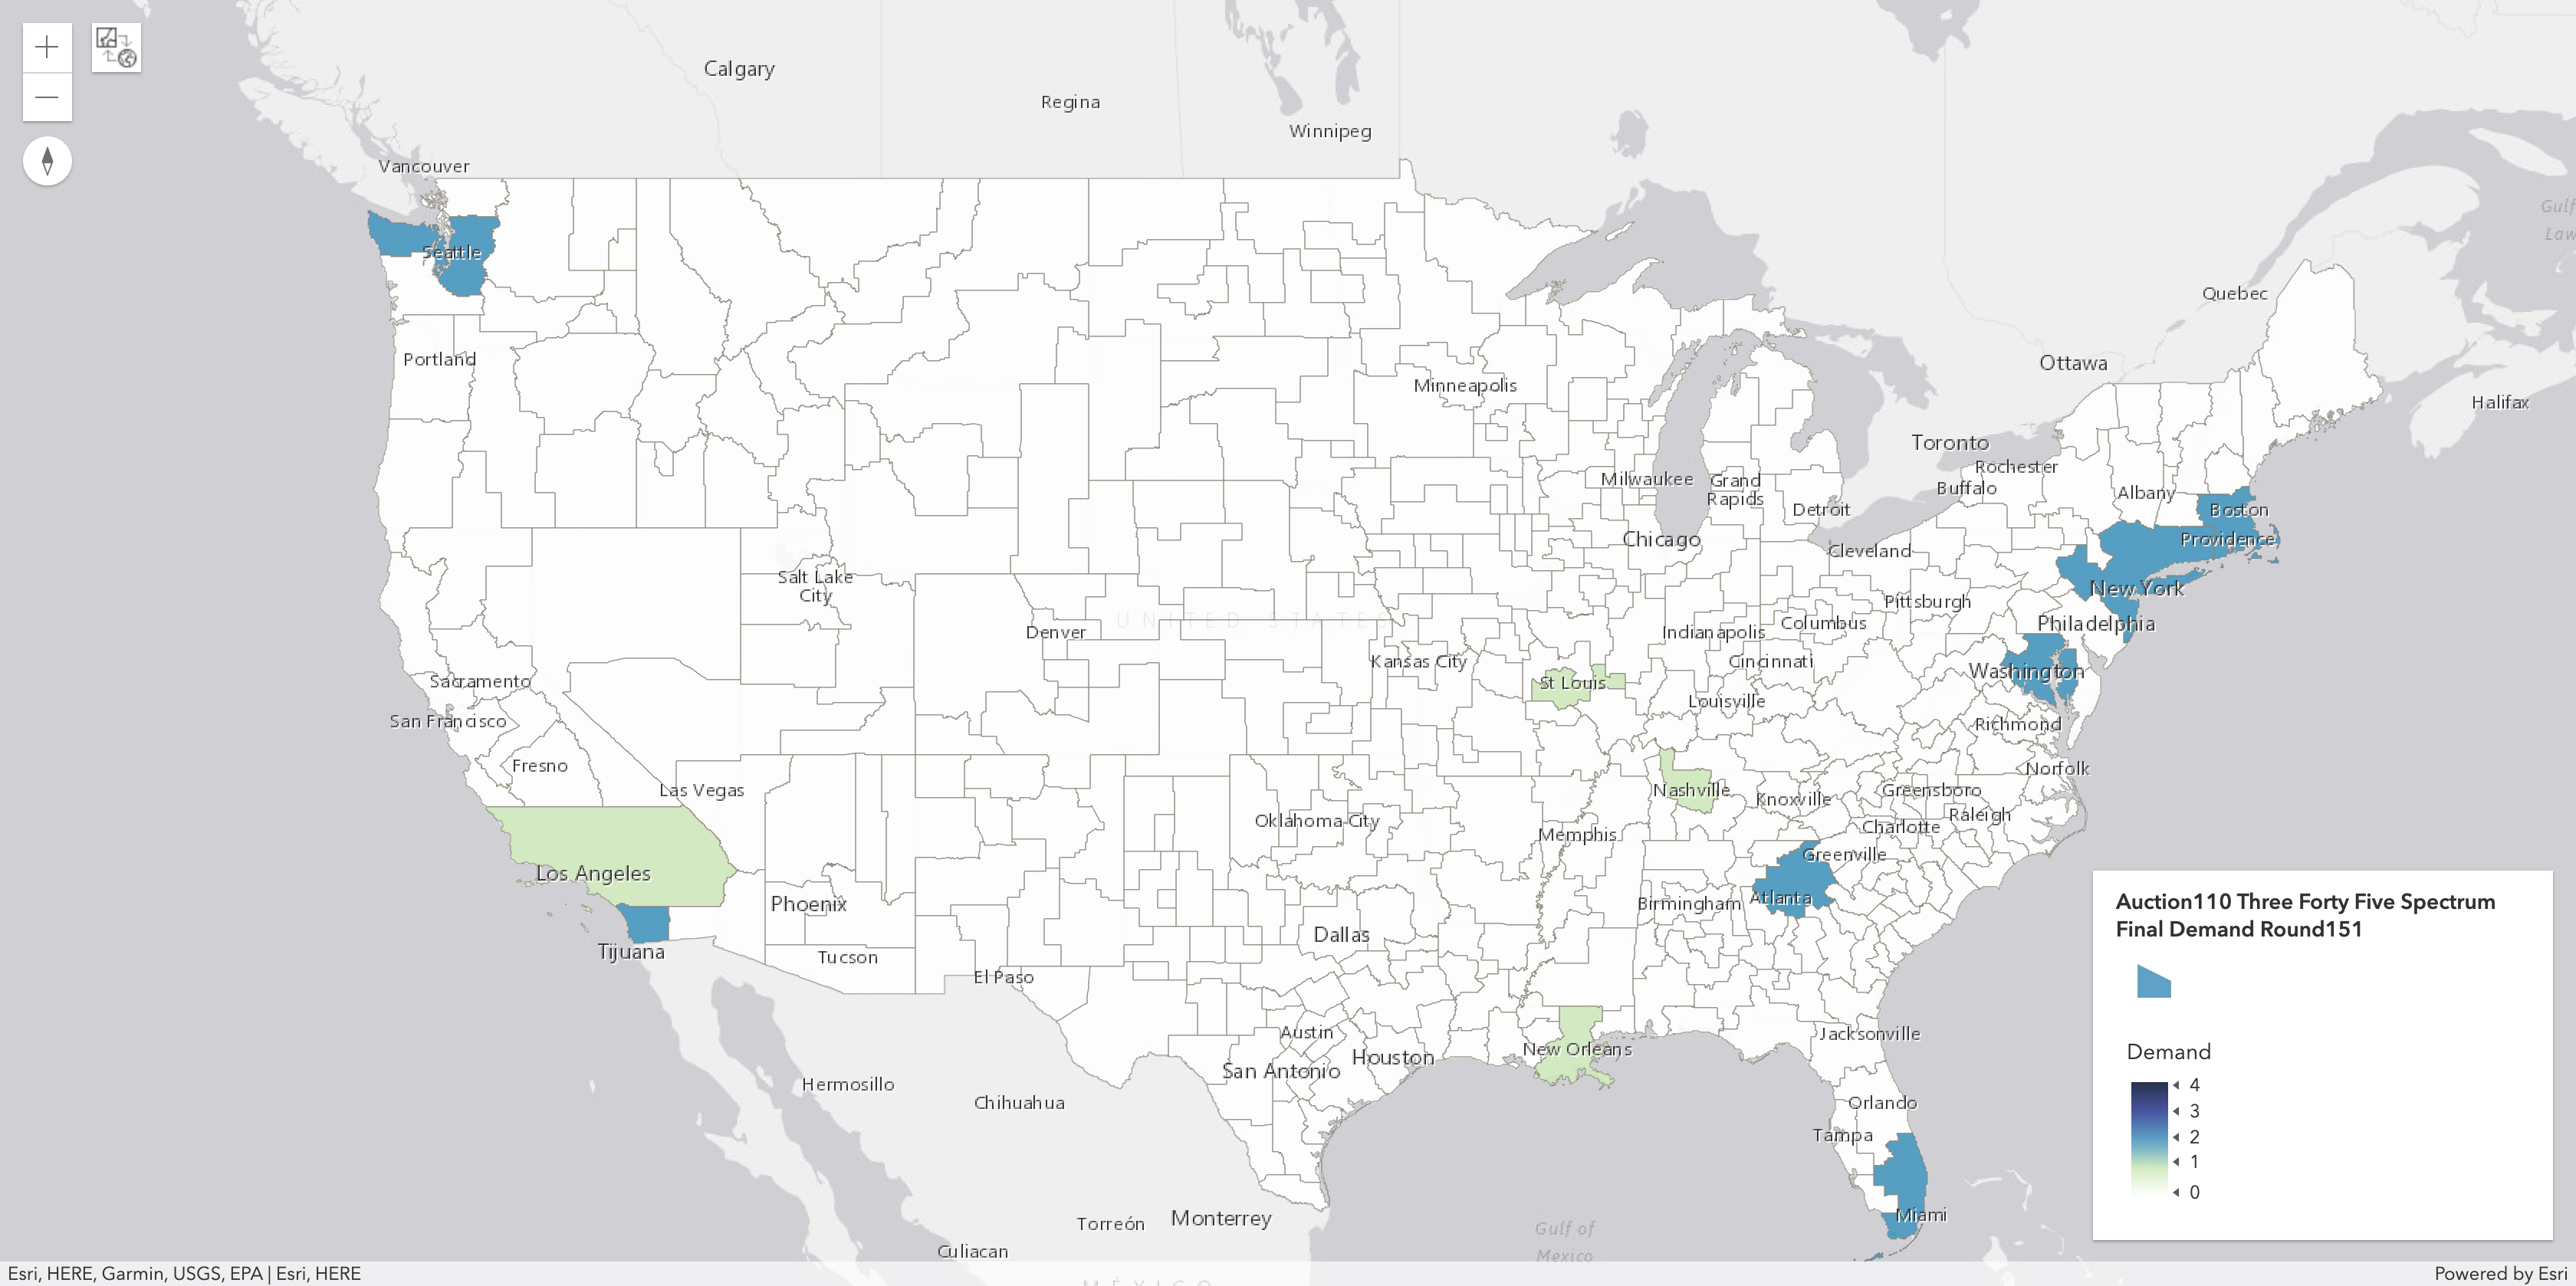
| Three Forty-Five Spectrum, LLC | 11 | 18 | 1.64 | 1.70 | 83,647,648 | 27.28% | $1,379,489,483 | $1,379,489,483 | $0.970668 | $0.970668 |
| United States Cellular Corporation | 104 | 380 | 3.65 | 3.60 | 33,537,087 | 10.94% | $579,646,526 | $579,646,526 | $0.480772 | $0.480772 |
| Whitewater Wireless II, L.P. | 11 | 14 | 1.27 | 1.20 | 37,085,744 | 12.09% | $427,906,975 | $402,906,975 | $0.964538 | $0.908186 |
| NewLevel III, L.P. | 6 | 8 | 1.33 | 1.20 | 32,843,728 | 10.71% | $375,665,956 | $375,665,956 | $0.954919 | $0.954919 |
| Cherry Wireless, LLC | 144 | 319 | 2.22 | 2.18 | 45,395,772 | 14.80% | $235,960,843 | $210,960,843 | $0.238591 | $0.213313 |
| N Squared Wireless, LLC | 25 | 55 | 2.20 | 2.13 | 11,300,177 | 3.68% | $101,852,981 | $76,852,981 | $0.423127 | $0.319269 |
| Skylake Wireless II, LLC | 33 | 57 | 1.73 | 1.66 | 12,823,804 | 4.18% | $52,511,264 | $39,383,448 | $0.247320 | $0.185490 |
| Blue Ridge Wireless LLC | 31 | 39 | 1.26 | 1.30 | 9,540,359 | 3.11% | $11,942,201 | $8,956,651 | $0.096314 | $0.072236 |
| Agri-Valley Communications, Inc. | 3 | 7 | 2.33 | 2.16 | 1,279,264 | 0.42% | $9,508,003 | $8,081,803 | $0.343573 | $0.292037 |
| LICT Wireless Broadband Company, LLC | 12 | 24 | 2.00 | 2.00 | 1,396,672 | 0.46% | $7,742,202 | $7,742,202 | $0.277166 | $0.277166 |
| NE Colorado Cellular, Inc. | 5 | 18 | 3.60 | 3.10 | 352,999 | 0.12% | $6,360,008 | $5,406,007 | $0.581423 | $0.494209 |
| Nsight Spectrum, LLC | 3 | 6 | 2.00 | 2.00 | 607,187 | 0.20% | $4,687,882 | $4,687,882 | $0.386033 | $0.386033 |
| East Kentucky Network, LLC | 1 | 2 | 2.00 | 2.00 | 631,120 | 0.21% | $5,140,000 | $4,369,000 | $0.407213 | $0.346131 |
| Carolina West Wireless, Inc. | 4 | 11 | 2.75 | 3.26 | 701,304 | 0.23% | $4,526,920 | $3,847,882 | $0.198200 | $0.168470 |
| PVT Networks, Inc. | 2 | 6 | 3.00 | 3.45 | 305,750 | 0.10% | $2,316,030 | $1,968,625 | $0.219749 | $0.186787 |
| RSA 1 Limited Partnership | 1 | 1 | 1.00 | 1.00 | 65,203 | 0.02% | $1,737,360 | $1,737,360 | $2.664540 | $2.664540 |
| Raptor Wireless LLC | 3 | 6 | 2.00 | 2.00 | 1,534,627 | 0.50% | $845,700 | $845,700 | $0.027554 | $0.027554 |
| Horry Telephone Cooperative, Inc. | 3 | 12 | 4.00 | 4.00 | 857,906 | 0.28% | $103,600 | $88,060 | $0.003019 | $0.002566 |
| PocketiNet Communications, Inc. | 1 | 1 | 1.00 | 1.00 | 62,859 | 0.02% | $70,001 | $59,501 | $0.111362 | $0.094658 |
| Jones, Anthony L | 2 | 2 | 1.00 | 1.00 | 29,736 | 0.01% | $2,100 | $1,575 | $0.007062 | $0.005297 |
(3) See explanation above regarding bidder names.
POST-AUCTION ANALYSIS: LICENSE HOLDINGS IN LARGEST MARKETS(4)
(4) See explanation above regarding bidder names.
POST-AUCTION ANALYSIS: Demand Reduction by Bidder In Each Round (in $)(5)
(5) See explanation above regarding bidder names.
POST-AUCTION ANALYSIS: Maps of Licenses Won By Key Bidders(6)
(6)The Net Price per MHz-POP for Category 1 and Category 2 Licenses are shown as Net_$_Cat1 and Net_$_Cat2 when you click on any license.
AT&T Licenses Won (All Categories)

T-Mobile Licenses Won (All Categories)

DISH (Weminuche) Licenses Won (All Categories)

Three Forty-Five Spectrum Licenses Won (All Categories)

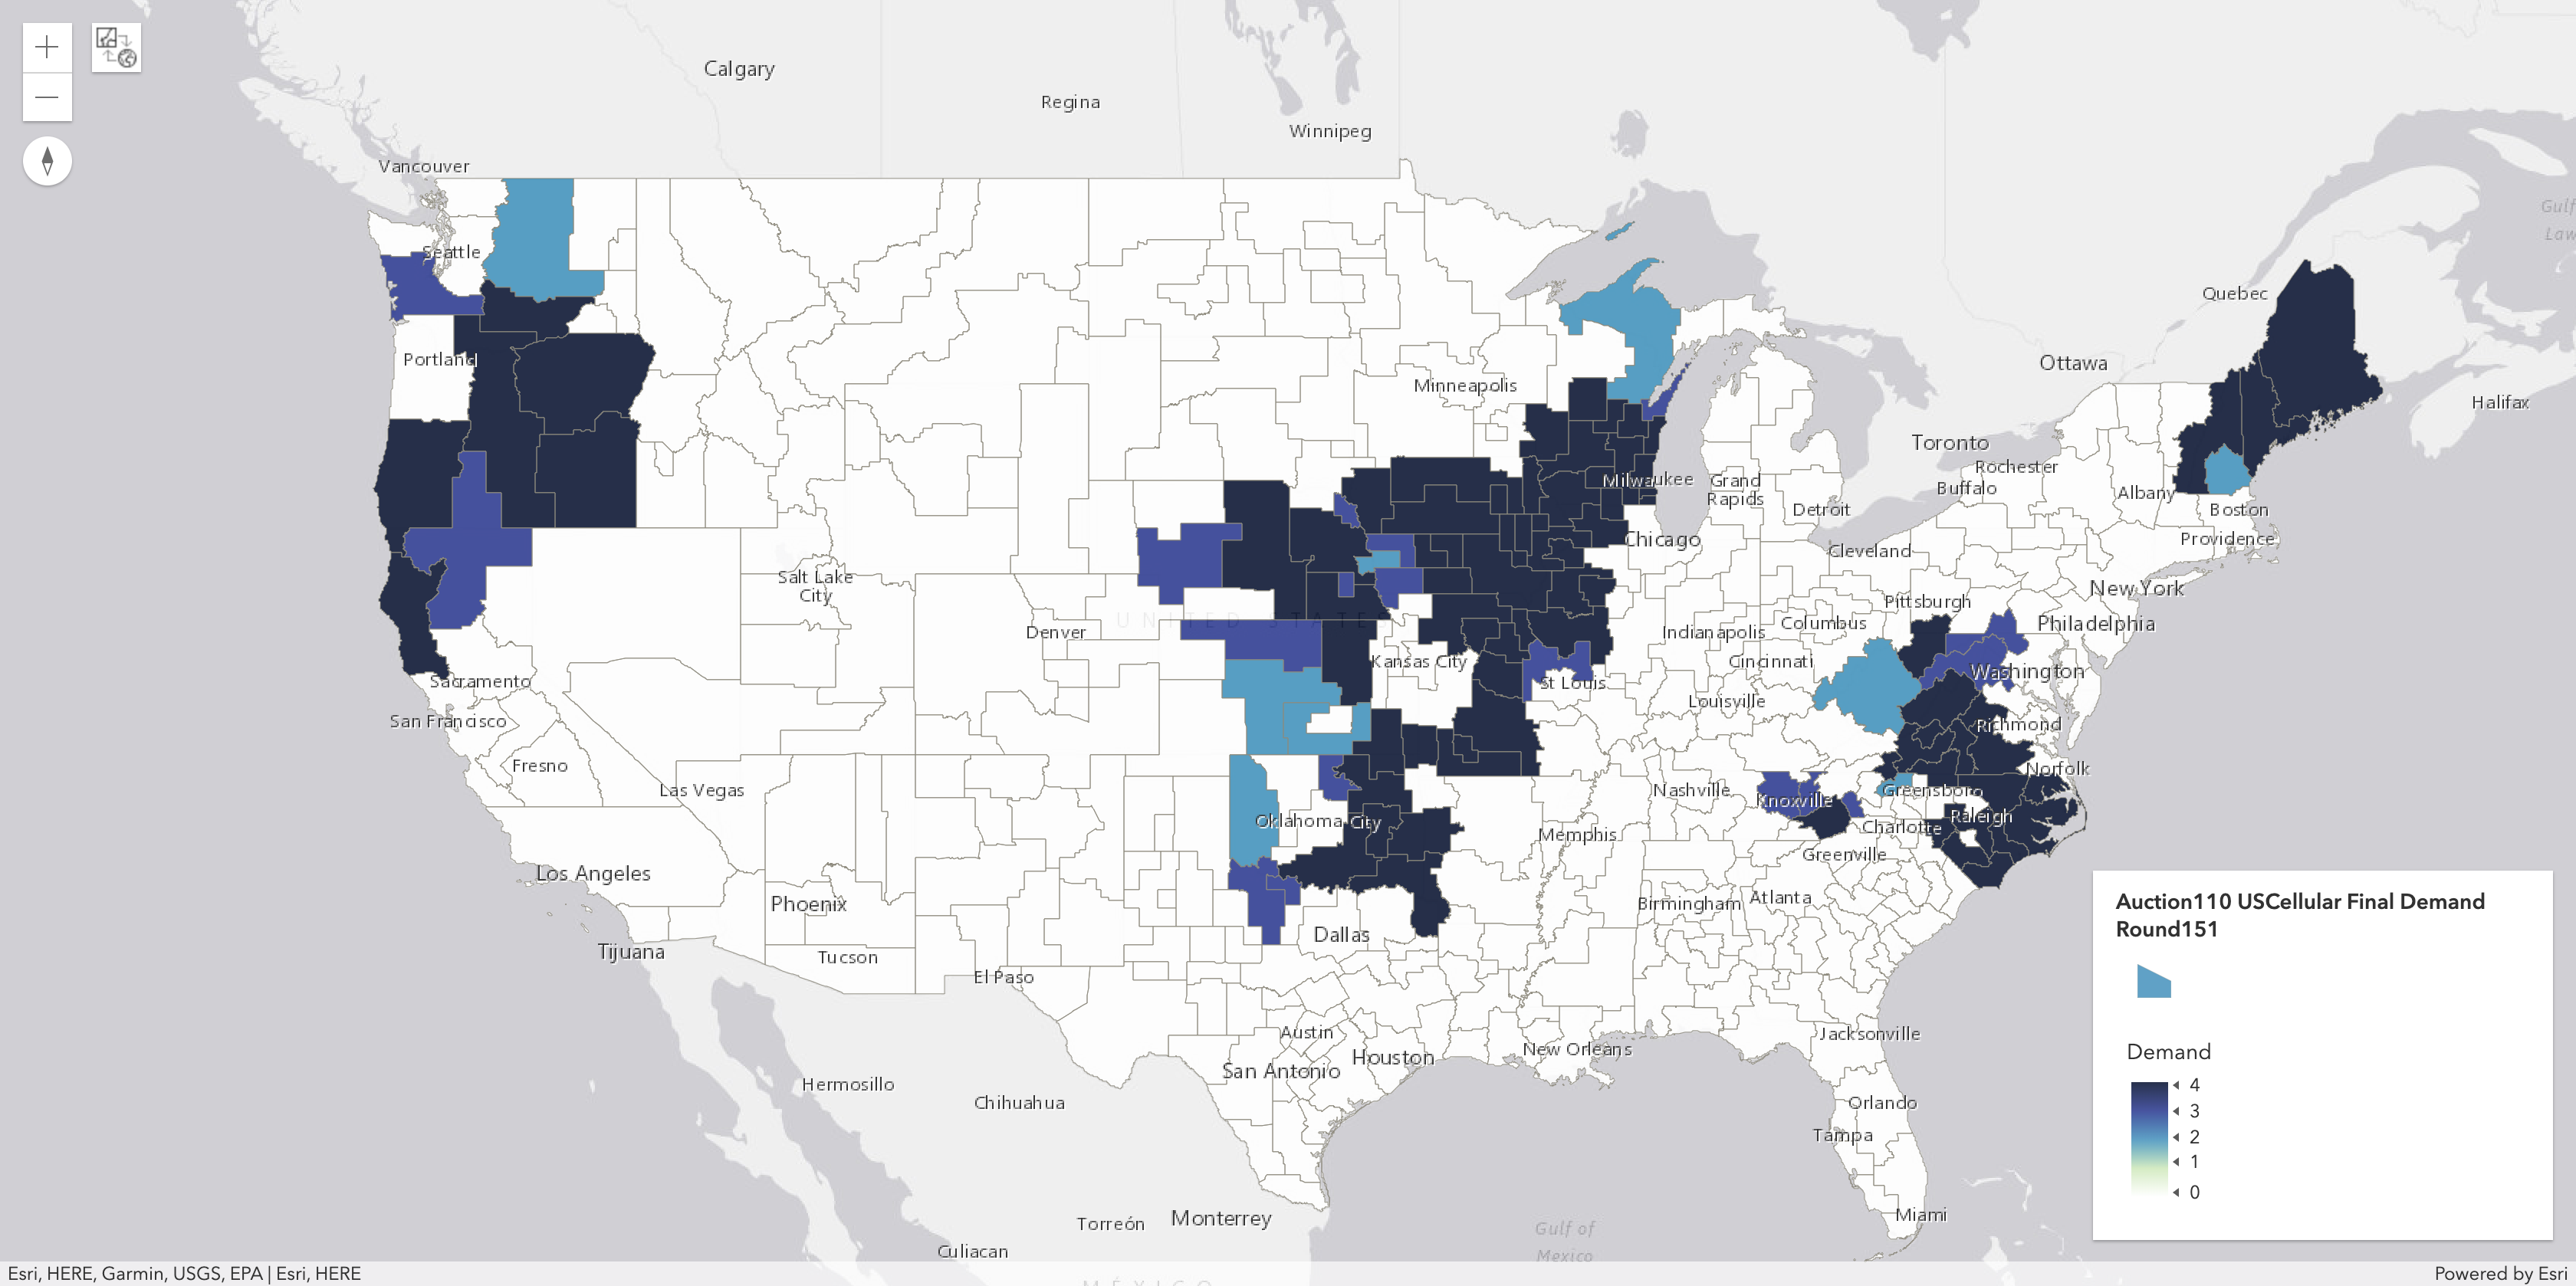
US Cellular Licenses Won (All Categories)

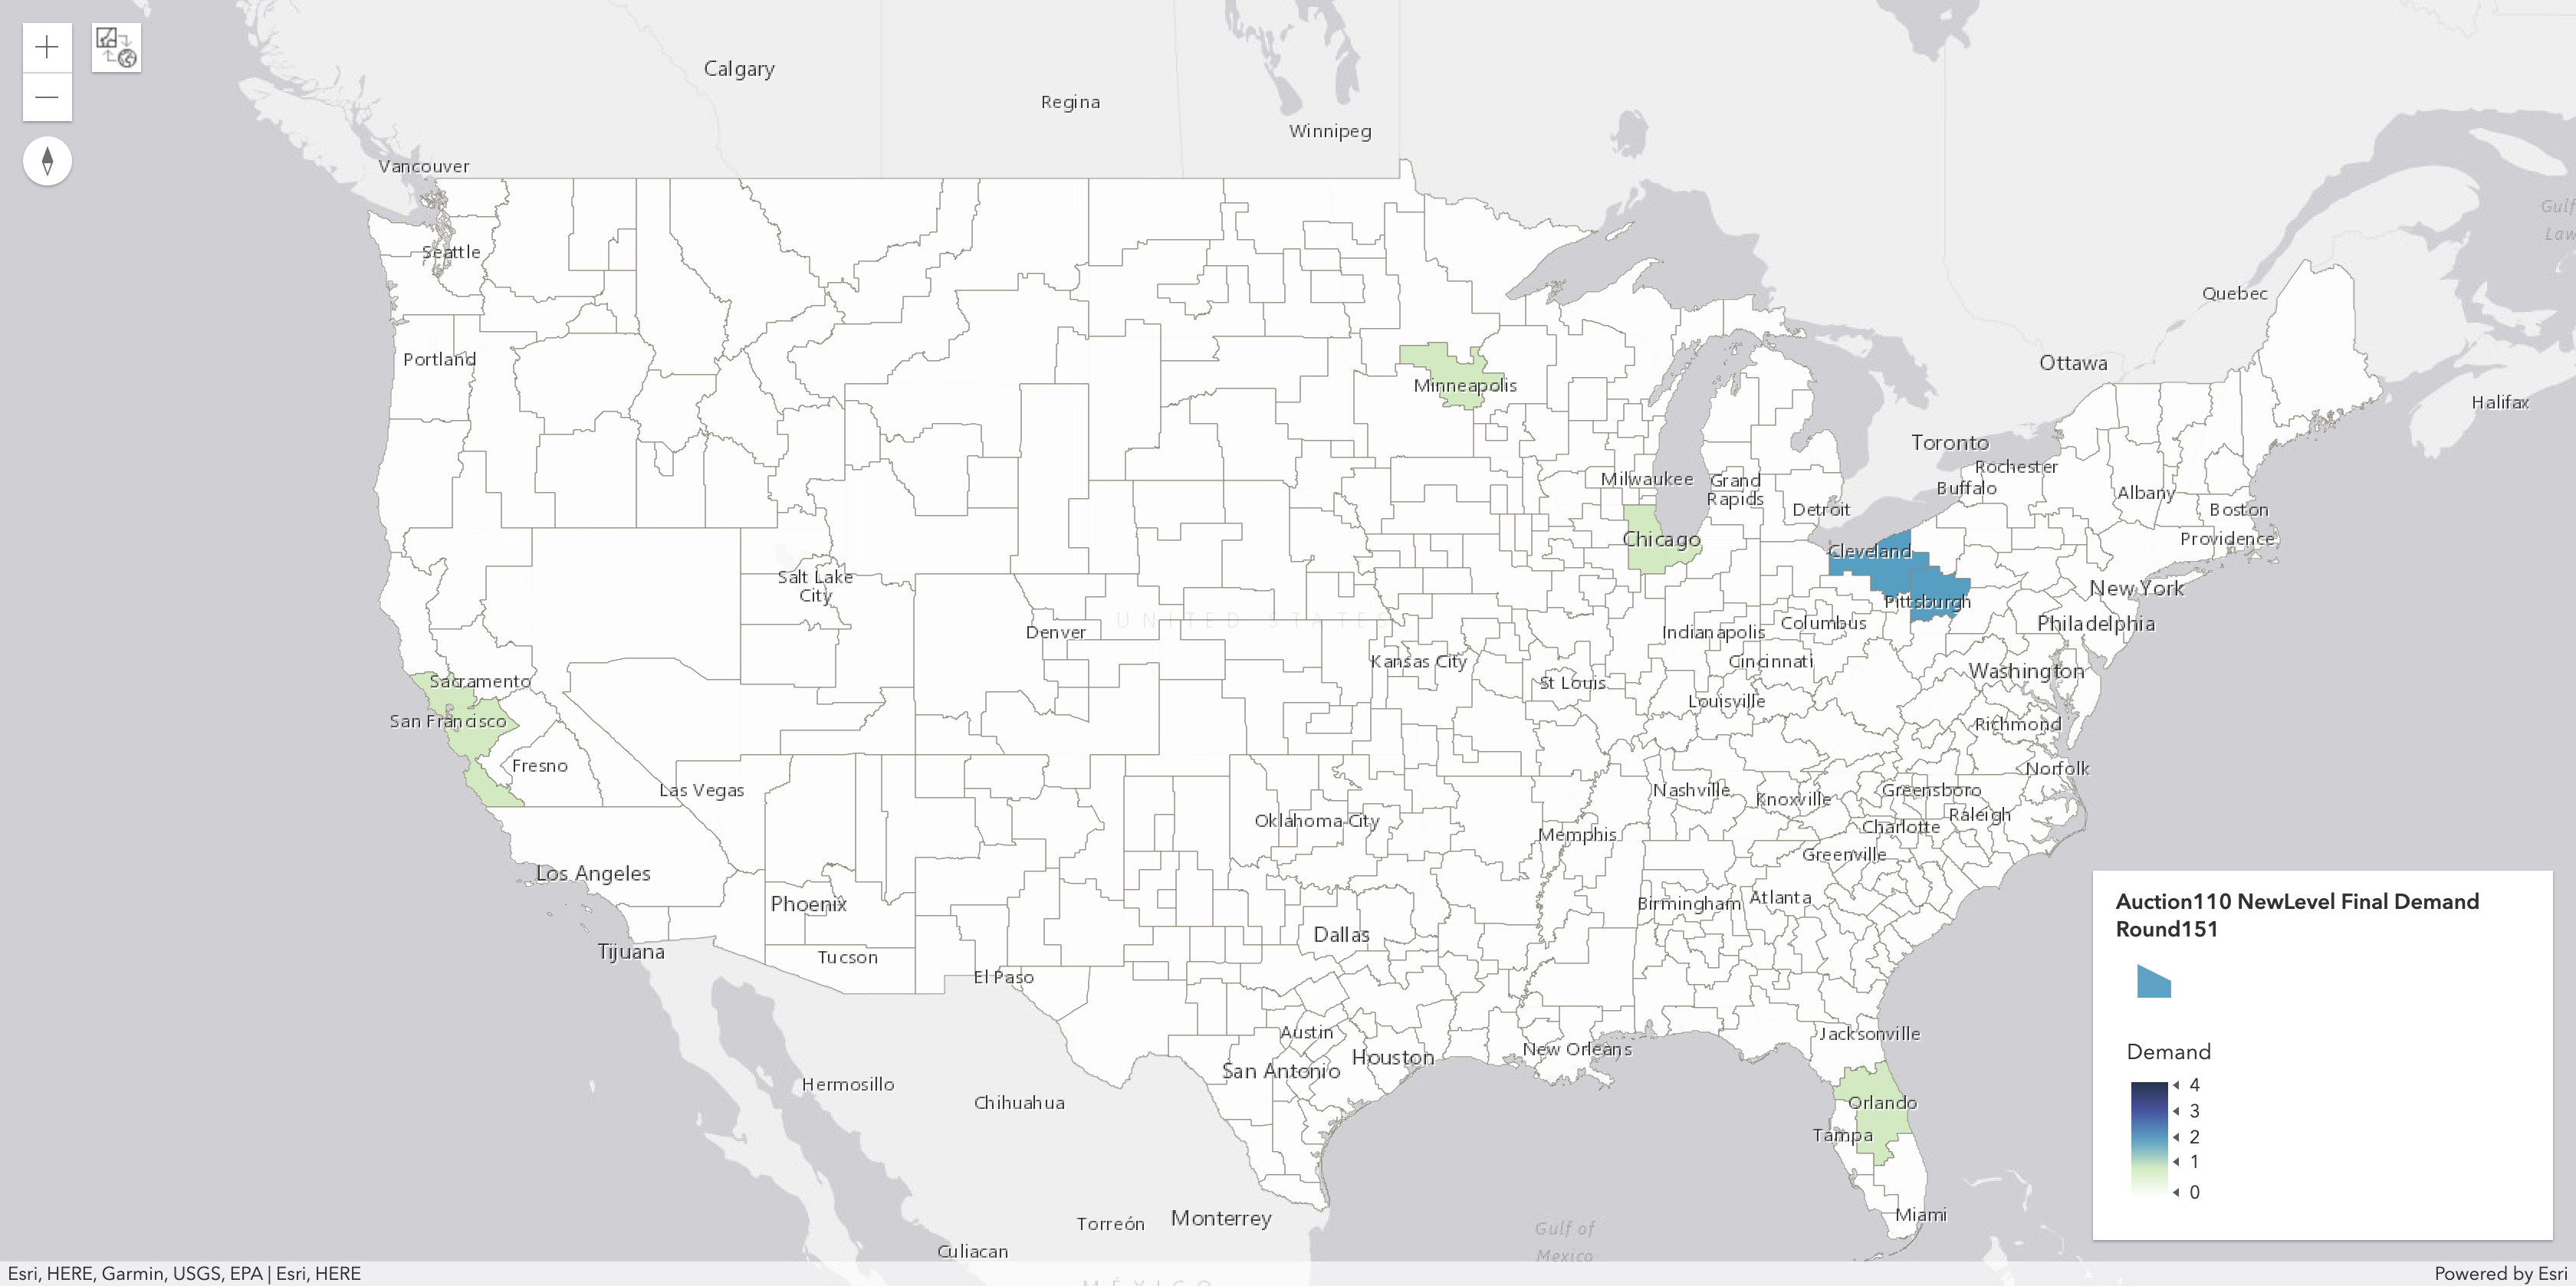
NewLevel III, L.P. Licenses Won (All Categories)

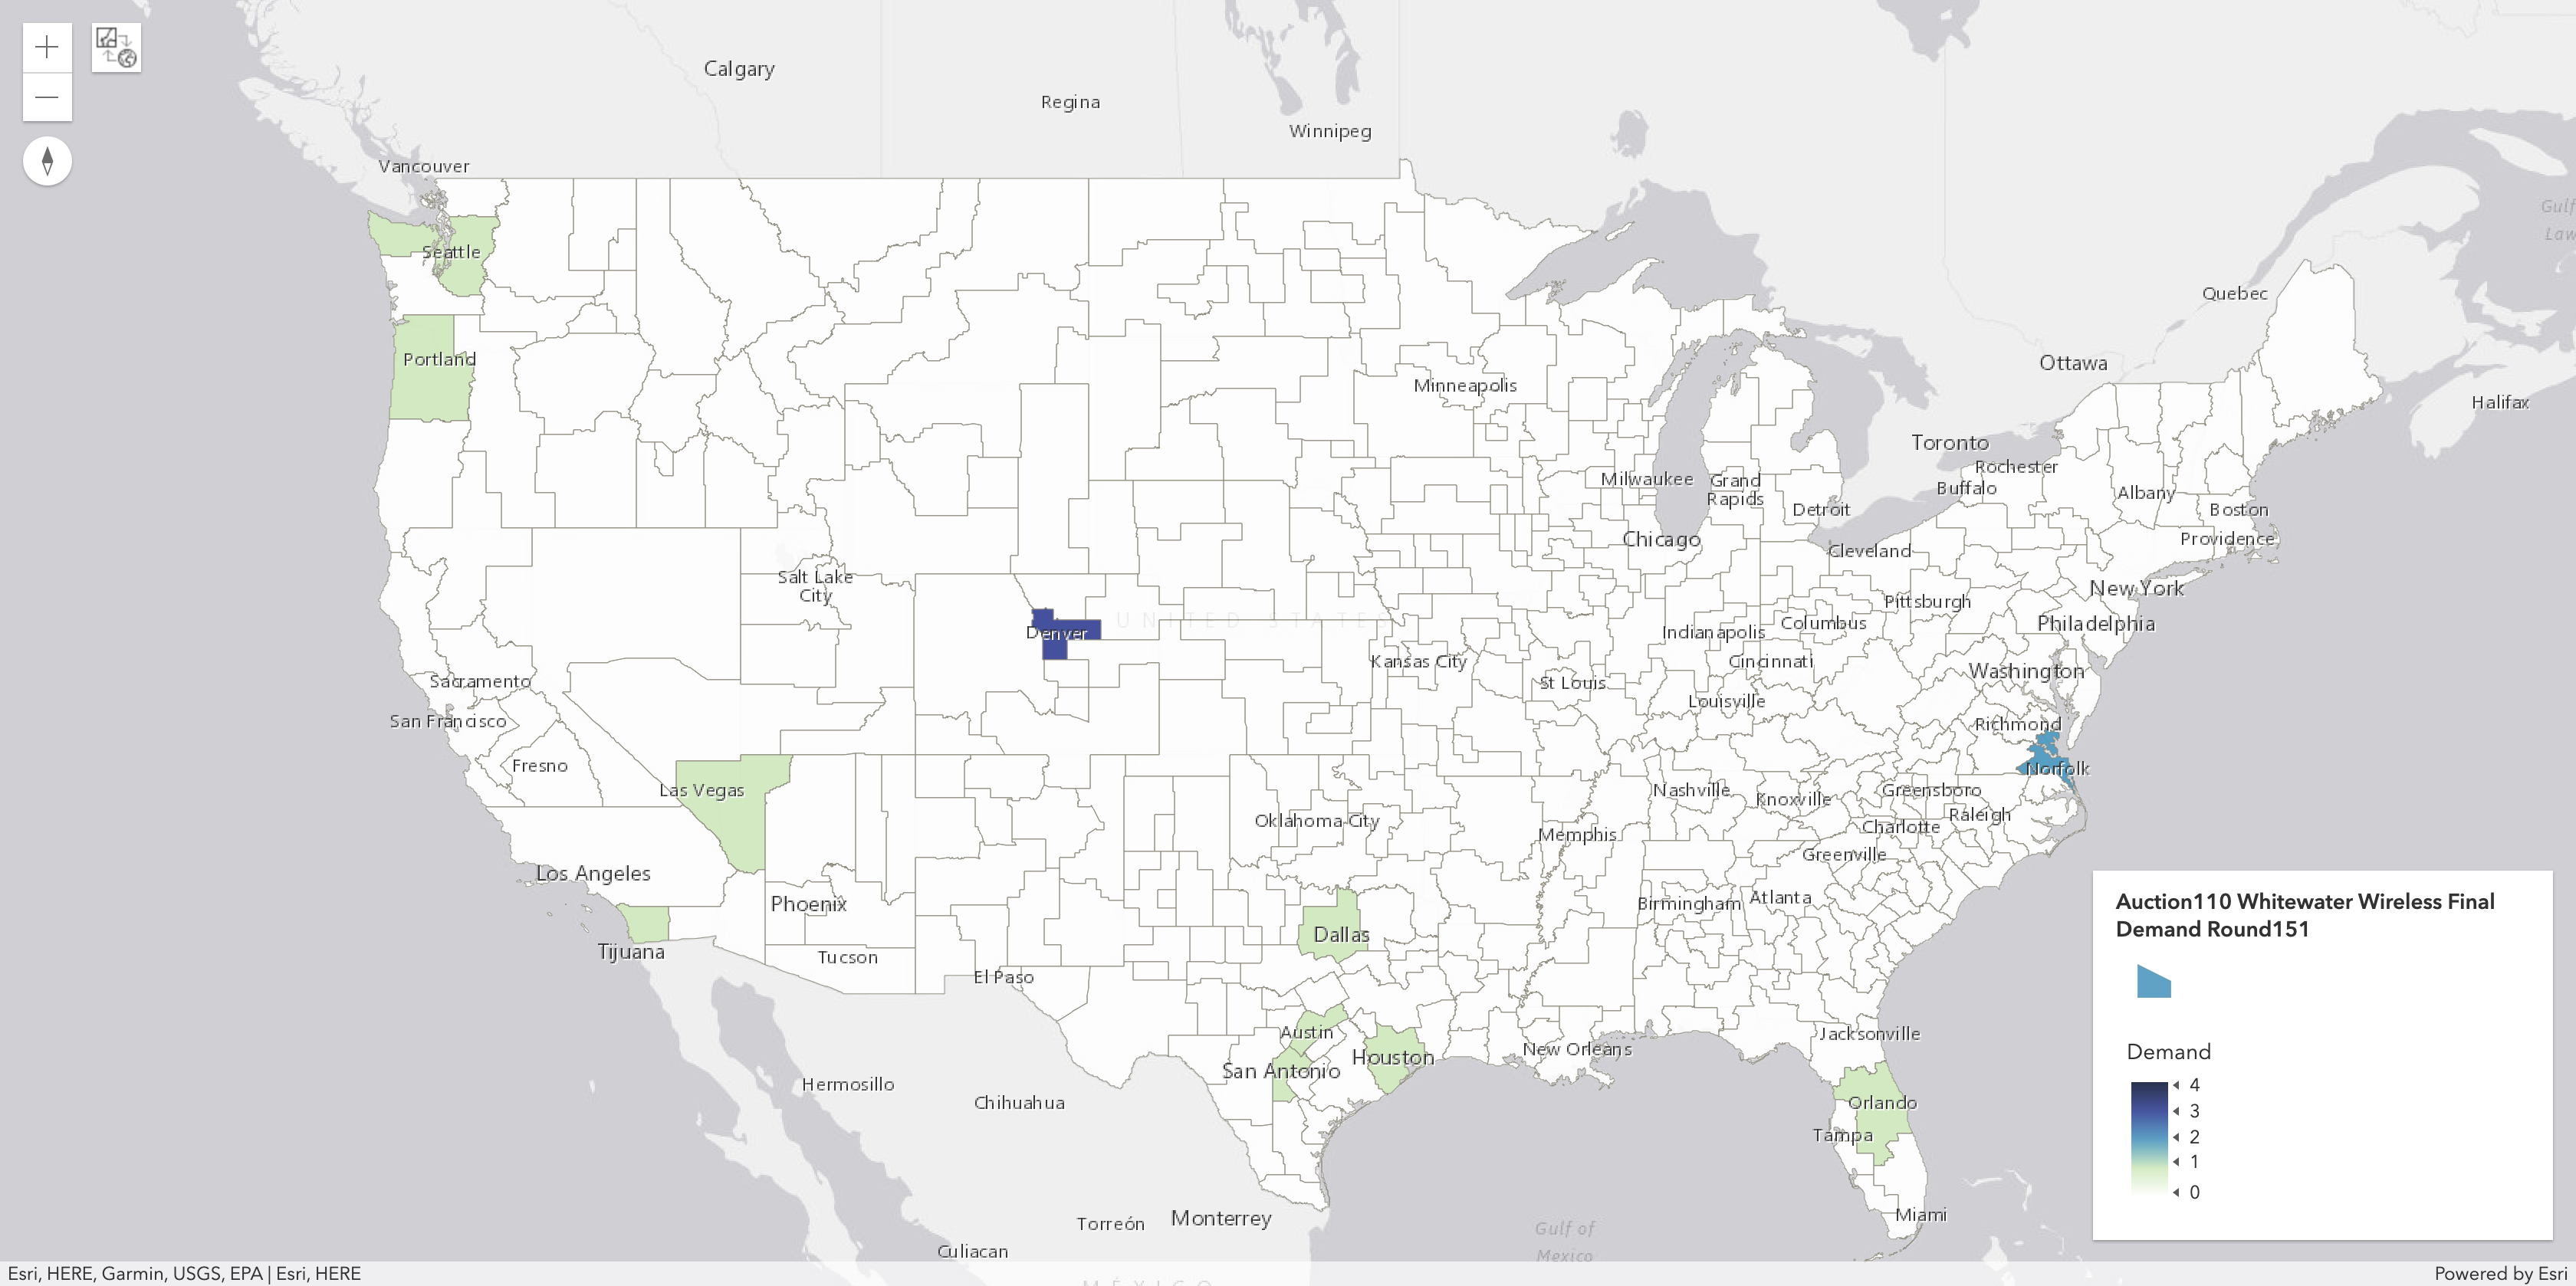
Whitewater Wireless II Licenses Won (All Categories)

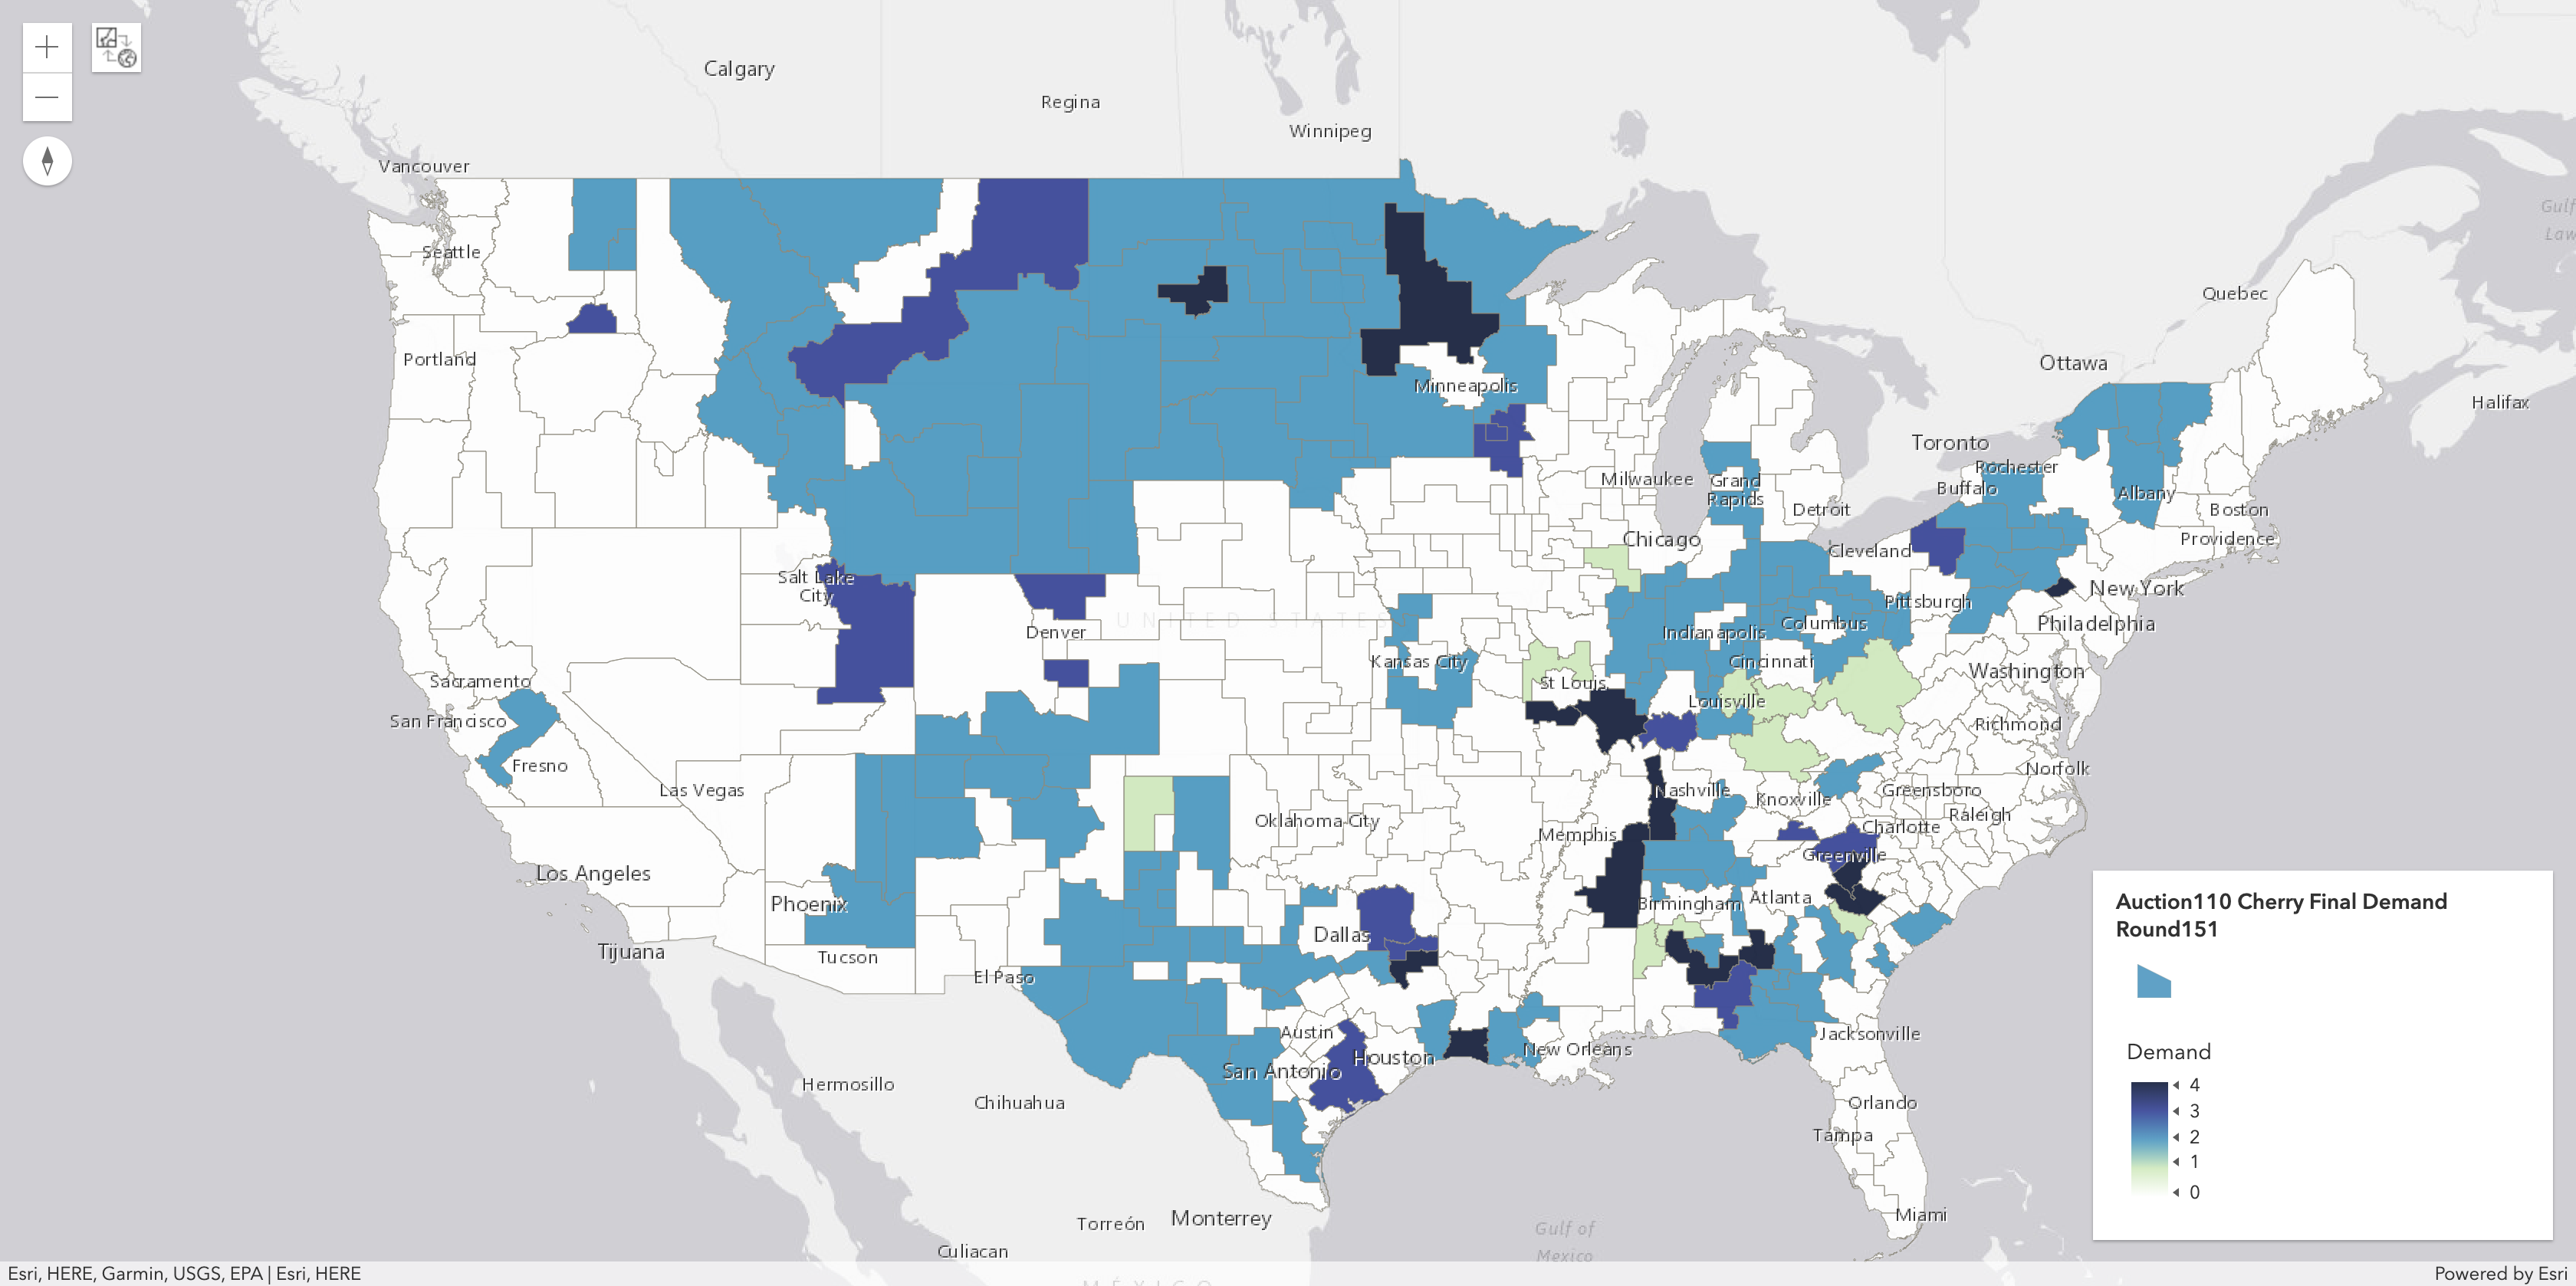
Cherry Wireless Licenses Won (All Categories)

CLOCK STAGE ANALYSIS: Auction 110 Summary (3450-3550 MHz Band)
General Auction Statistics at End of Round
151:
PEA-Level Statistics at the End of Round 151:
Nationwide Price Per MHz-POP Statistics at End of Round 151:
NEW:
Compare Price Per MHz-POP in PEAs with Both Cat1 and Cat2 Blocks at End of Round 151:
Nationwide Gross Proceeds by Category at End of Round 151:
Minimum Proceeds Required to Purchase One Block Nationwide at End of Round 151:
| Gross Proceeds after Round: | $21,888,007,794 |
| Qualified Bidders (Clock Phase): | 33 |
| Products with Supply < Demand: | 0 |
| Products with Supply = Demand: | 474 |
| Products with Supply > Demand: | 7 |
|
Products with No Demand:
(subset of Products with Supply > Demand) |
3 |
| Total Provisionally Sold Blocks: | 4041 |
| Total Unsold Blocks: | 19 |
PEA-Level Statistics at the End of Round 151:
| PEAs with Supply < Demand: | 0 |
| PEAs with Supply = Demand: | 399 |
| PEAs with Supply > Demand: | 7 |
|
PEAs with No Demand:
(subset of PEAs with Supply > Demand) |
0 |
| Largest PEA (by Population) with Demand Change: | Abilene, TX |
Nationwide Price Per MHz-POP Statistics at End of Round 151:
| Based on 2010 Census Data | Based on 2020 Census Data(7) | |
| Average Across All Categories: | $0.715639 | $0.666422 |
| Category 1: | $0.717029 | $0.666967 |
| Category 2: | $0.694720 | $0.658063 |
(7) Because the FCC and DoD released their data for this auction using 2010 Census Data, we use 2010 Census population estimates except where explicitly stated otherwise (as is the case here).
NEW:
Compare Price Per MHz-POP in PEAs with Both Cat1 and Cat2 Blocks at End of Round 151:
| Based on 2010 Census Data | |
| Category 1: | $0.087877 |
| Category 2: | $0.694720 |
Nationwide Gross Proceeds by Category at End of Round 151:
| Category 1: | $20,564,198,224 |
| Category 2: | $1,323,809,570 |
Minimum Proceeds Required to Purchase One Block Nationwide at End of Round 151:
| Any Category: | $2,070,769,345 |
Estimated Shortfall to Reserve Price at End of Round
151:
| Reserve Price: | $14,775,354,330 |
| Shortfall (based on gross proceeds): | $0 | Shortfall (based on estimated net proceeds)(8): | $0 |
(8) To calculate net proceeds we assume that gross revenues will be reduced by 1% due to bidding credits.
This is 1% estimate may be conservative based on past auctions.
This is 1% estimate may be conservative based on past auctions.
NEW: Post Clock Stage Pricing Comparisons Across 3 GHz Spectrum Auctions
Price Per MHz-POP by Market Rank Tiers for Auction 105, 107 and 110
Price Per MHz-POP by PEA for Auction 105, 107 and 110(9)
(9) Use slider to zoom into a particular set of PEAs in the Top 50 Markets.
Price Per MHz-POP Analysis
Average Price Per MHz-POP in Each PEA after Round 151: (average across all categories in each PEA)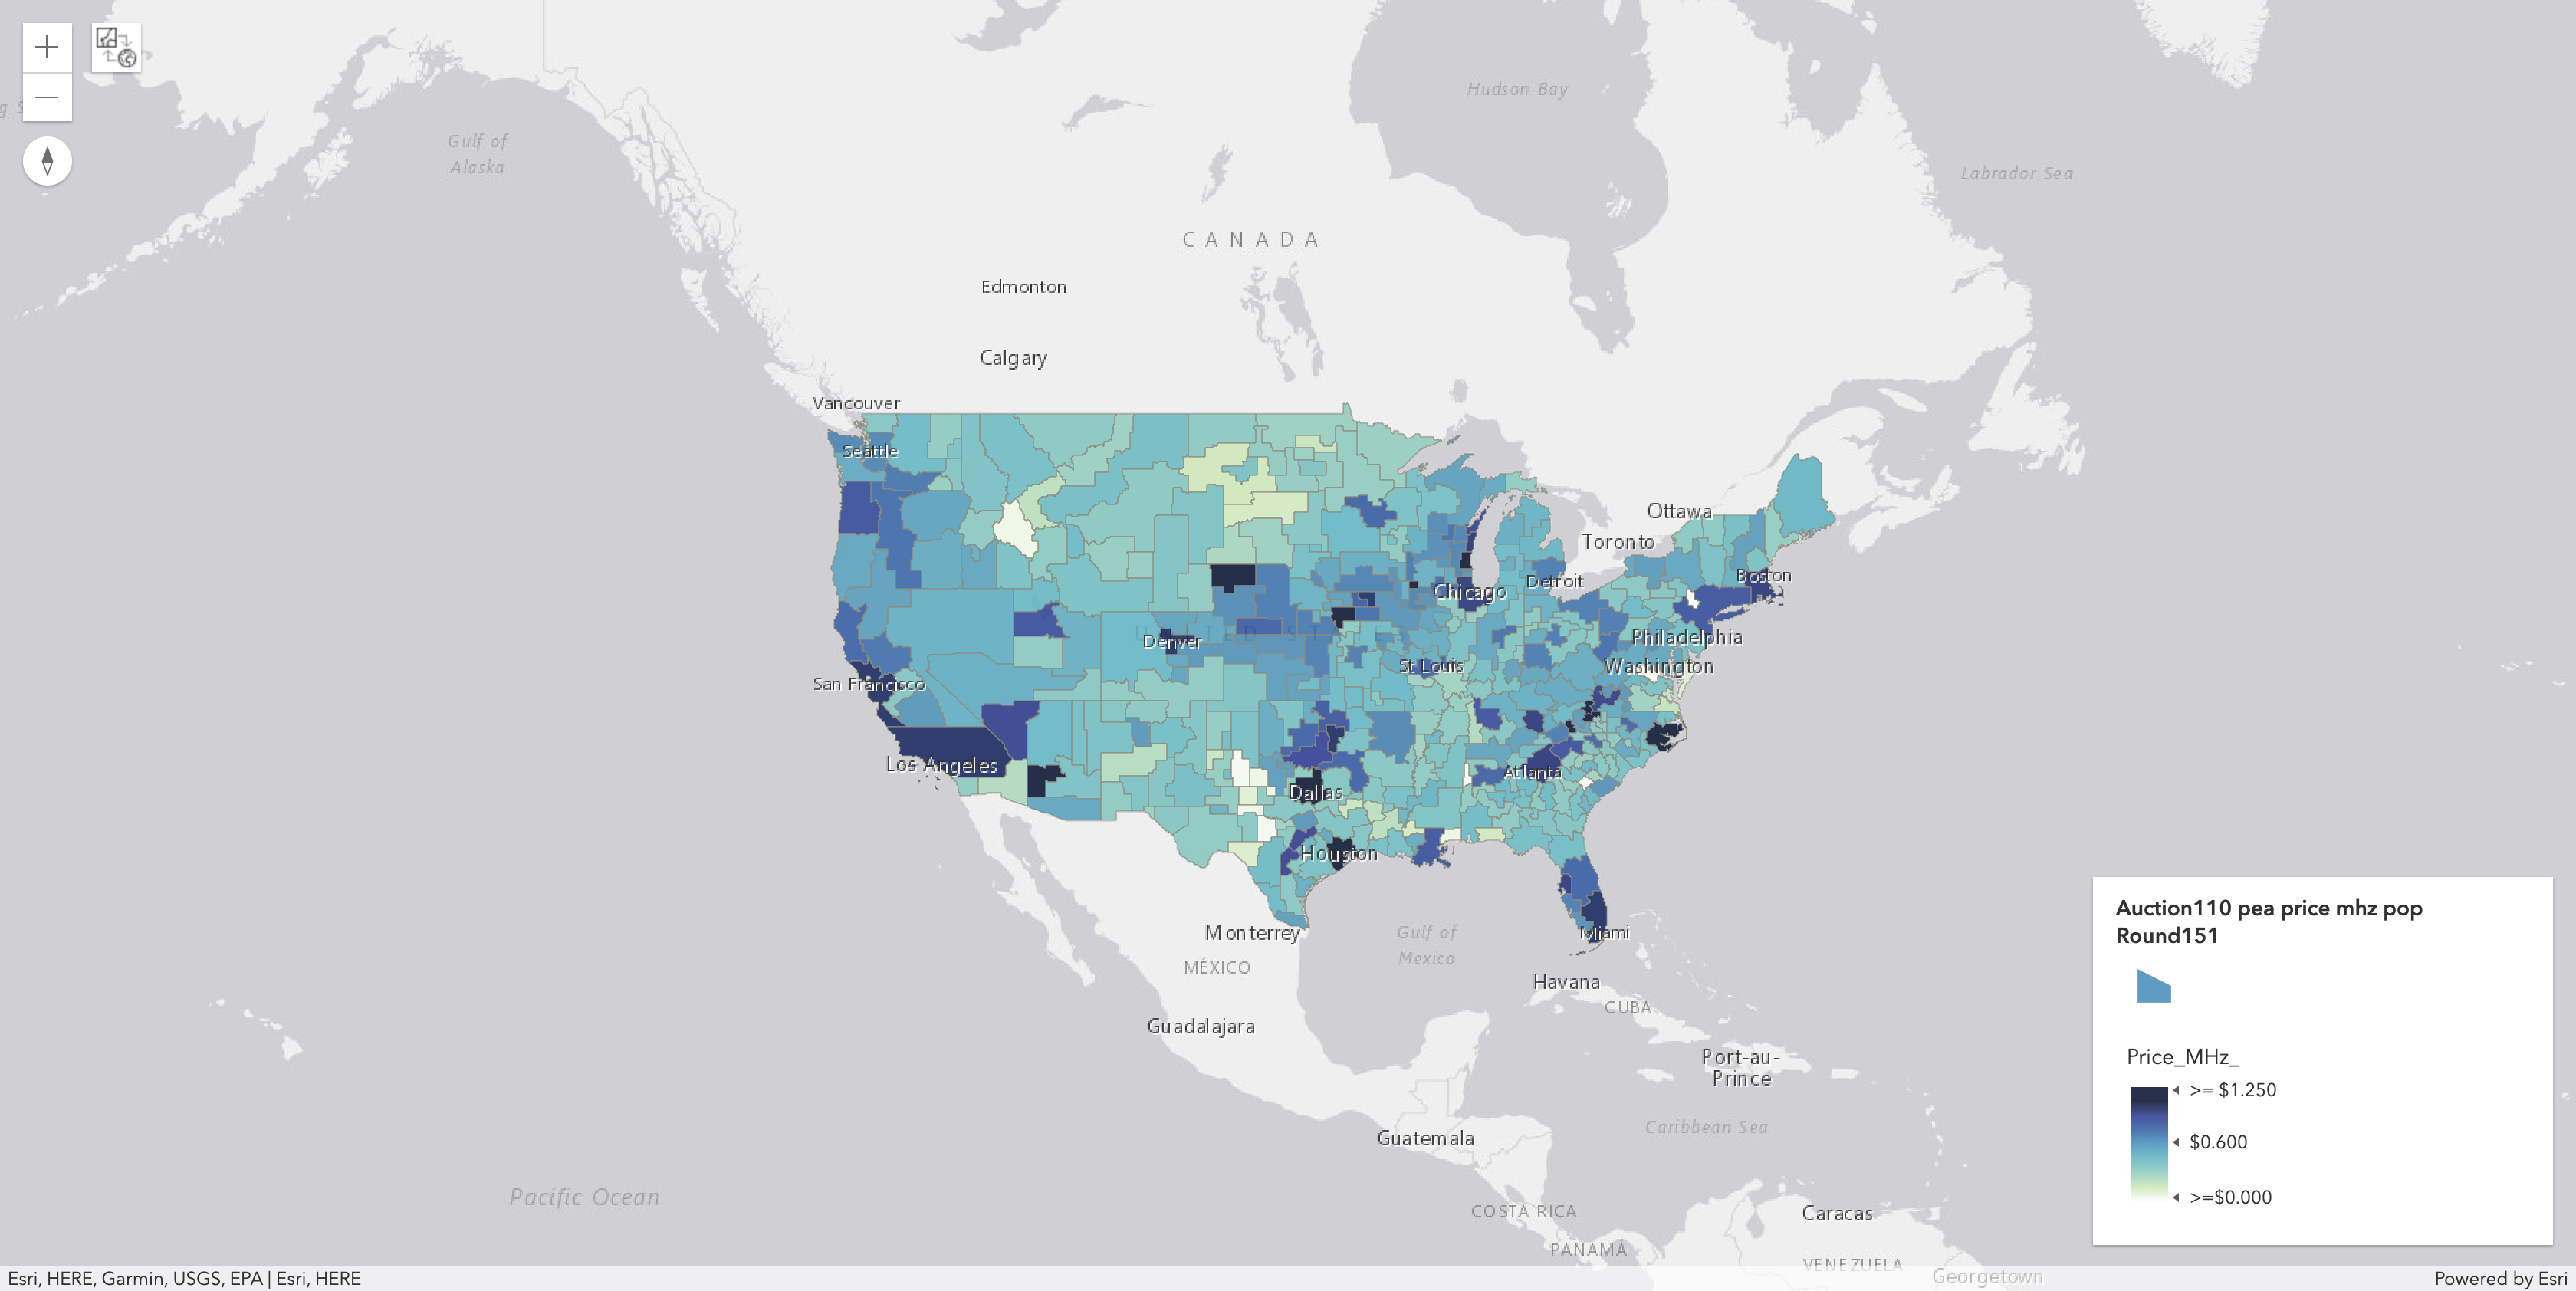
Average Price Per MHz-POP in Each PEA after Round 151: (average across all categories in each PEA)

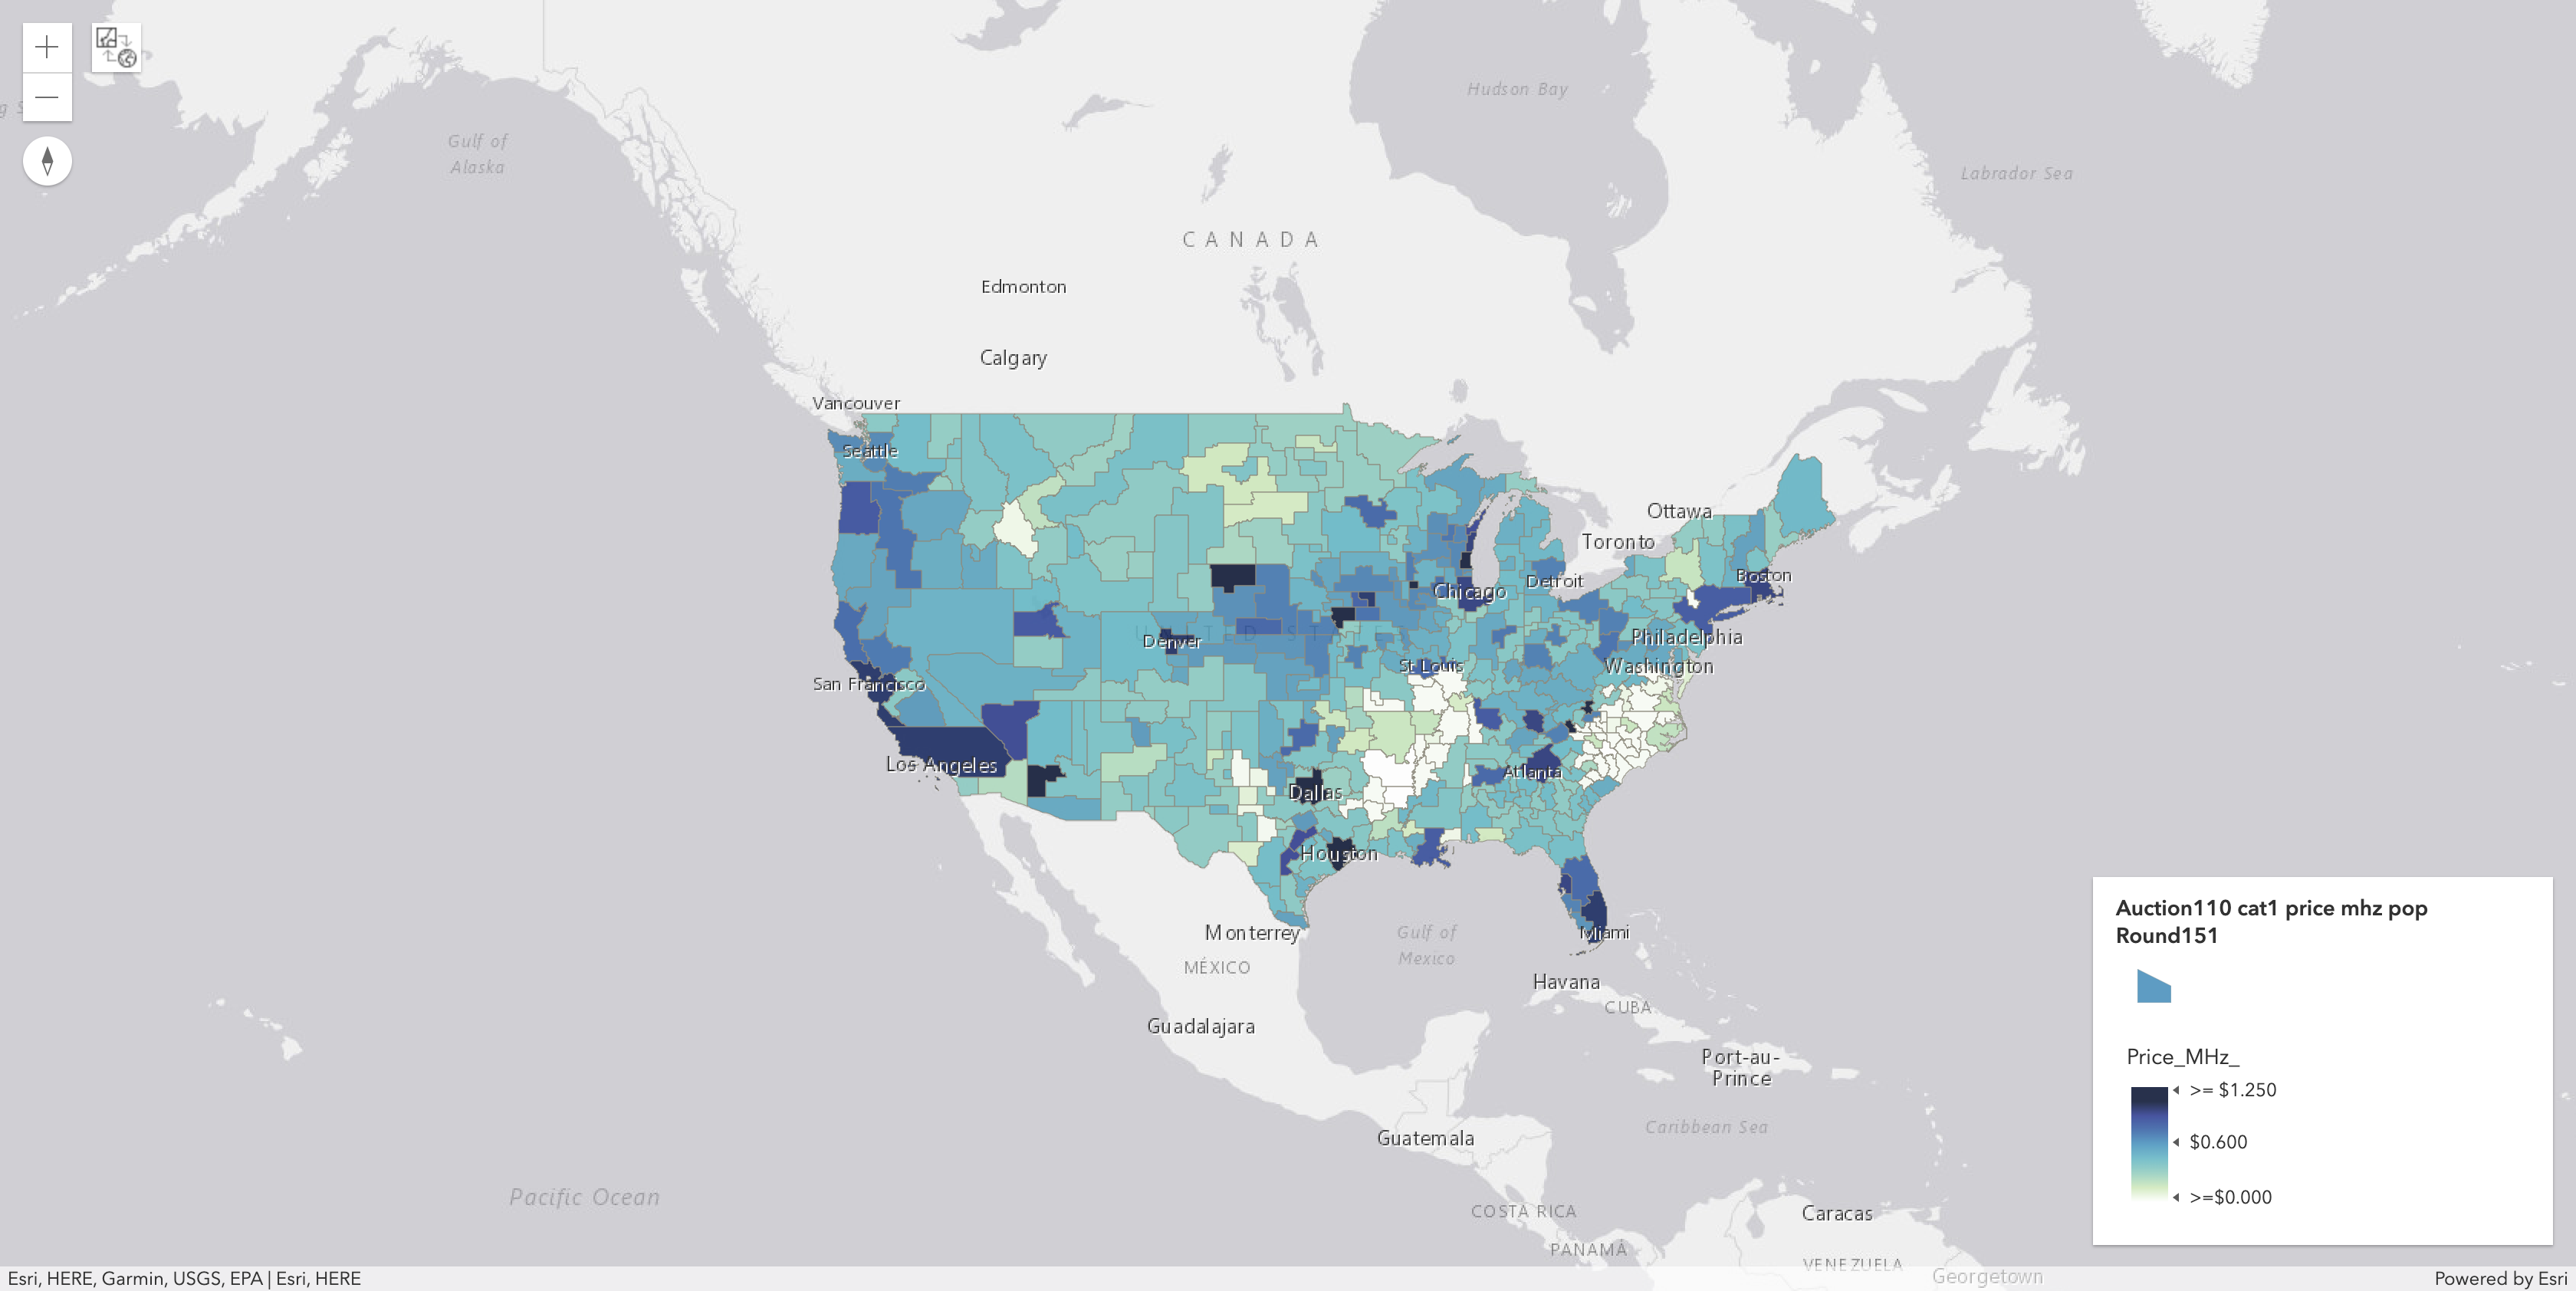
Price Per MHz-POP in Each PEA for Category 1 after Round
151:

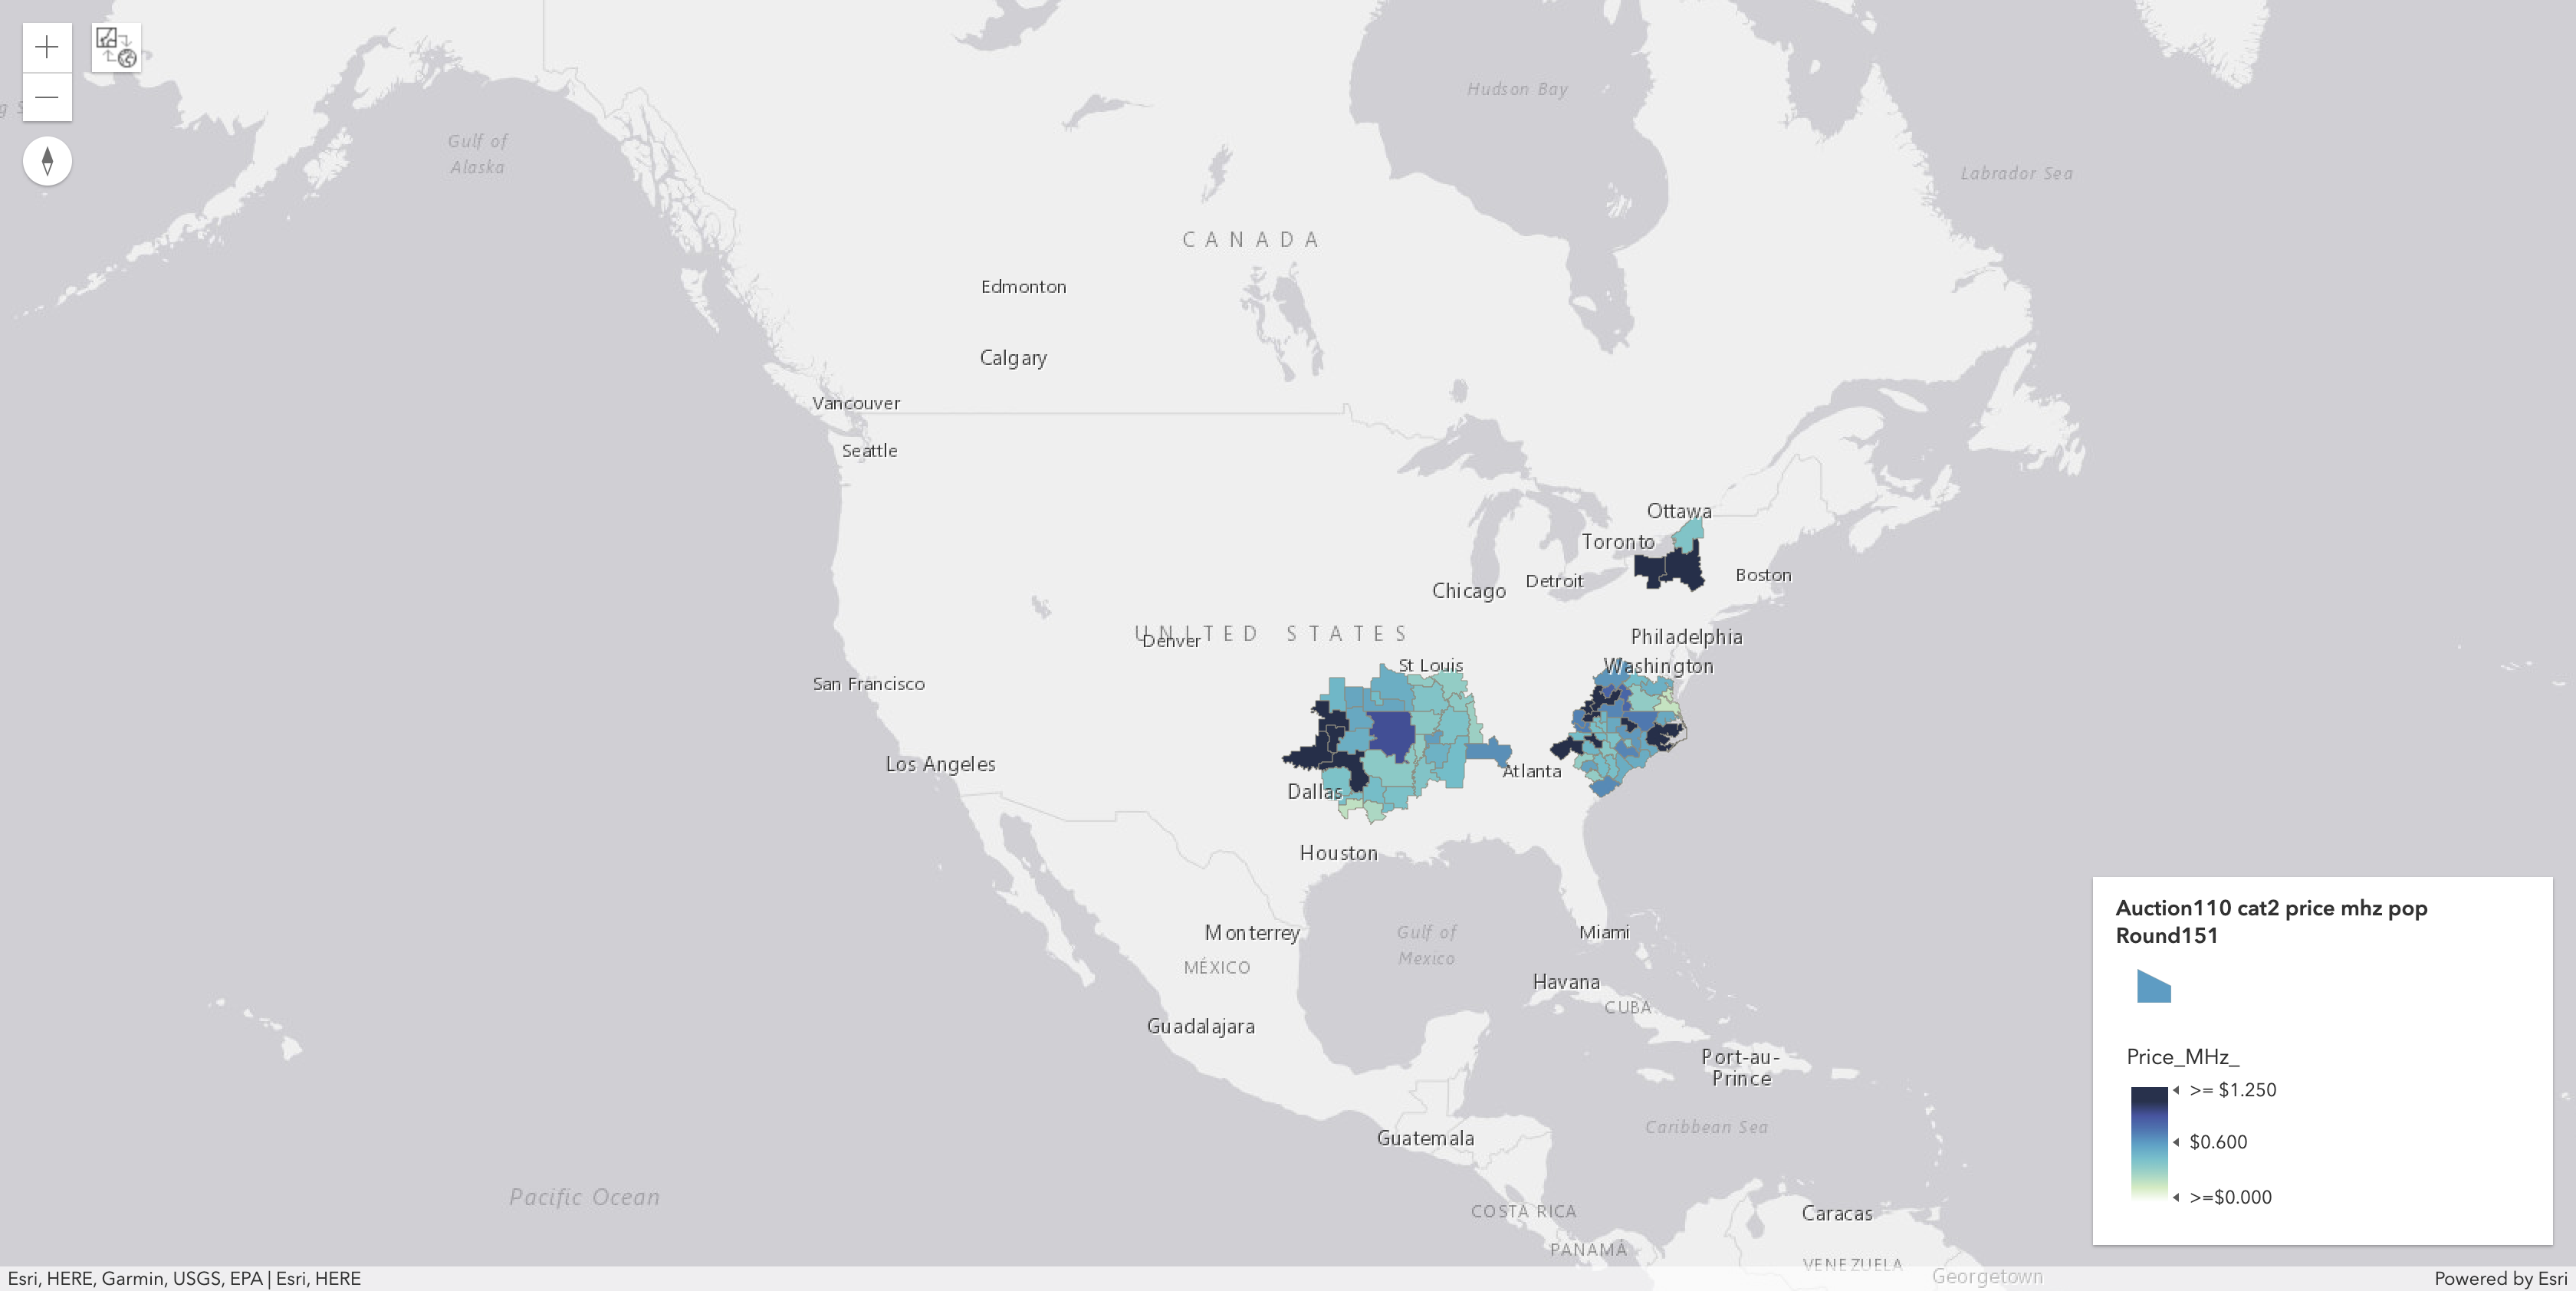
Price Per MHz-POP in Each PEA for Category 2 after Round
151:

Price Per MHz-POP in Top 20 PEAs by Population after Round
151:
| market_number | market_name | category | aggregate_demand | posted_price | supply | gross_proceeds | price_mhz_pop |
|---|---|---|---|---|---|---|---|
| PEA001 | New York, NY | Cat1 | 10 | $234,163,000 | 10 | $2,341,630,000 | $0.927854 |
| PEA002 | Los Angeles, CA | Cat1 | 10 | $239,780,000 | 10 | $2,397,800,000 | $1.235332 |
| PEA003 | Chicago, IL | Cat1 | 10 | $105,297,000 | 10 | $1,052,970,000 | $1.124162 |
| PEA004 | San Francisco, CA | Cat1 | 10 | $111,665,001 | 10 | $1,116,650,010 | $1.236883 |
| PEA005 | Baltimore, MD-Washington, DC | Cat1 | 10 | $33,994,000 | 10 | $339,940,000 | $0.433479 |
| PEA006 | Philadelphia, PA | Cat1 | 10 | $20,421,000 | 10 | $204,210,000 | $0.269149 |
| PEA007 | Boston, MA | Cat1 | 10 | $77,261,200 | 10 | $772,612,000 | $1.140213 |
| PEA008 | Dallas, TX | Cat1 | 10 | $89,190,006 | 10 | $891,900,060 | $1.382261 |
| PEA009 | Miami, FL | Cat1 | 10 | $77,874,000 | 10 | $778,740,000 | $1.237690 |
| PEA010 | Houston, TX | Cat1 | 10 | $73,705,006 | 10 | $737,050,060 | $1.250934 |
| PEA011 | Atlanta, GA | Cat1 | 10 | $61,892,000 | 10 | $618,920,000 | $1.138702 |
| PEA012 | Detroit, MI | Cat1 | 10 | $35,892,000 | 10 | $358,920,000 | $0.698631 |
| PEA013 | Orlando, FL | Cat1 | 10 | $38,585,100 | 10 | $385,851,000 | $0.845675 |
| PEA014 | Cleveland, OH | Cat1 | 10 | $28,641,000 | 10 | $286,410,000 | $0.699127 |
| PEA015 | Phoenix, AZ | Cat1 | 10 | $48,037,000 | 10 | $480,370,000 | $1.258463 |
| PEA016 | Seattle, WA | Cat1 | 10 | $24,109,006 | 10 | $241,090,060 | $0.635749 |
| PEA017 | Minneapolis-St. Paul, MN | Cat1 | 10 | $28,761,080 | 10 | $287,610,800 | $0.848387 |
| PEA018 | San Diego, CA | Cat1 | 10 | $4,283,000 | 10 | $42,830,000 | $0.138370 |
| PEA019 | Portland, OR | Cat1 | 10 | $28,544,000 | 10 | $285,440,000 | $0.944339 |
| PEA020 | Denver, CO | Cat1 | 10 | $34,592,000 | 10 | $345,920,000 | $1.240004 |
20 Most Expensive PEAs by Price Per MHz-POP after Round
151: (ave. for all categories)
| market_number | market_name | price_mhz_pop |
|---|---|---|
| PEA369 | Red Oak, IA | $2.664540 |
| PEA304 | Mount Airy, NC | $2.324113 |
| PEA371 | Wytheville, VA | $1.957278 |
| PEA038 | Milwaukee, WI | $1.676194 |
| PEA410 | Valentine, NE | $1.585283 |
| PEA100 | Greenville, NC | $1.519378 |
| PEA008 | Dallas, TX | $1.382261 |
| PEA349 | Marion, NC | $1.352162 |
| PEA406 | Anamosa, IA | $1.332498 |
| PEA015 | Phoenix, AZ | $1.258463 |
| PEA010 | Houston, TX | $1.250934 |
| PEA020 | Denver, CO | $1.240004 |
| PEA009 | Miami, FL | $1.237690 |
| PEA004 | San Francisco, CA | $1.236883 |
| PEA002 | Los Angeles, CA | $1.235332 |
| PEA108 | Des Moines, IA | $1.231065 |
| PEA281 | Muskogee, OK | $1.226319 |
| PEA267 | Sheboygan, WI | $1.156137 |
| PEA007 | Boston, MA | $1.140213 |
| PEA011 | Atlanta, GA | $1.138702 |
20 Most Expensive Products by Price Per MHz-POP after Round 151: (any category)
| market_number | market_name | category | aggregate_demand | posted_price | supply | gross_proceeds | price_mhz_pop |
|---|---|---|---|---|---|---|---|
| PEA304 | Mount Airy, NC | Cat2 | 6 | $4,886,000 | 6 | $29,316,000 | $3.416473 |
| PEA369 | Red Oak, IA | Cat1 | 10 | $1,737,360 | 10 | $17,373,600 | $2.664540 |
| PEA100 | Greenville, NC | Cat2 | 6 | $14,311,000 | 6 | $85,866,000 | $2.502339 |
| PEA371 | Wytheville, VA | Cat2 | 6 | $1,412,000 | 6 | $8,472,000 | $2.242516 |
| PEA041 | Syracuse, NY | Cat2 | 2 | $27,579,000 | 2 | $55,158,000 | $2.010191 |
| PEA281 | Muskogee, OK | Cat2 | 6 | $3,032,000 | 6 | $18,192,000 | $1.711563 |
| PEA038 | Milwaukee, WI | Cat1 | 10 | $26,080,041 | 10 | $260,800,410 | $1.676194 |
| PEA173 | Blacksburg, VA | Cat2 | 6 | $5,913,000 | 6 | $35,478,000 | $1.675840 |
| PEA410 | Valentine, NE | Cat1 | 10 | $187,000 | 10 | $1,870,000 | $1.585283 |
| PEA371 | Wytheville, VA | Cat1 | 4 | $963,000 | 4 | $3,852,000 | $1.529421 |
| PEA211 | Ardmore, OK | Cat2 | 6 | $4,441,000 | 6 | $26,646,000 | $1.521782 |
| PEA044 | Rochester, NY | Cat2 | 2 | $19,890,000 | 2 | $39,780,000 | $1.511231 |
| PEA063 | Tulsa, OK | Cat2 | 6 | $14,482,840 | 6 | $86,897,040 | $1.494497 |
| PEA008 | Dallas, TX | Cat1 | 10 | $89,190,006 | 10 | $891,900,060 | $1.382261 |
| PEA045 | Raleigh, NC | Cat2 | 6 | $17,912,100 | 6 | $107,472,600 | $1.375335 |
| PEA050 | Greenville, SC | Cat2 | 6 | $16,766,100 | 6 | $100,596,600 | $1.373181 |
| PEA043 | Charlotte, NC | Cat2 | 6 | $18,208,100 | 6 | $109,248,600 | $1.372119 |
| PEA349 | Marion, NC | Cat1 | 10 | $1,060,000 | 10 | $10,600,000 | $1.352162 |
| PEA406 | Anamosa, IA | Cat1 | 10 | $275,001 | 10 | $2,750,010 | $1.332498 |
| PEA181 | Texarkana, TX | Cat2 | 6 | $4,441,000 | 6 | $26,646,000 | $1.293975 |
Deep Dive: Required Coordination in the 3450-3550 MHz Band
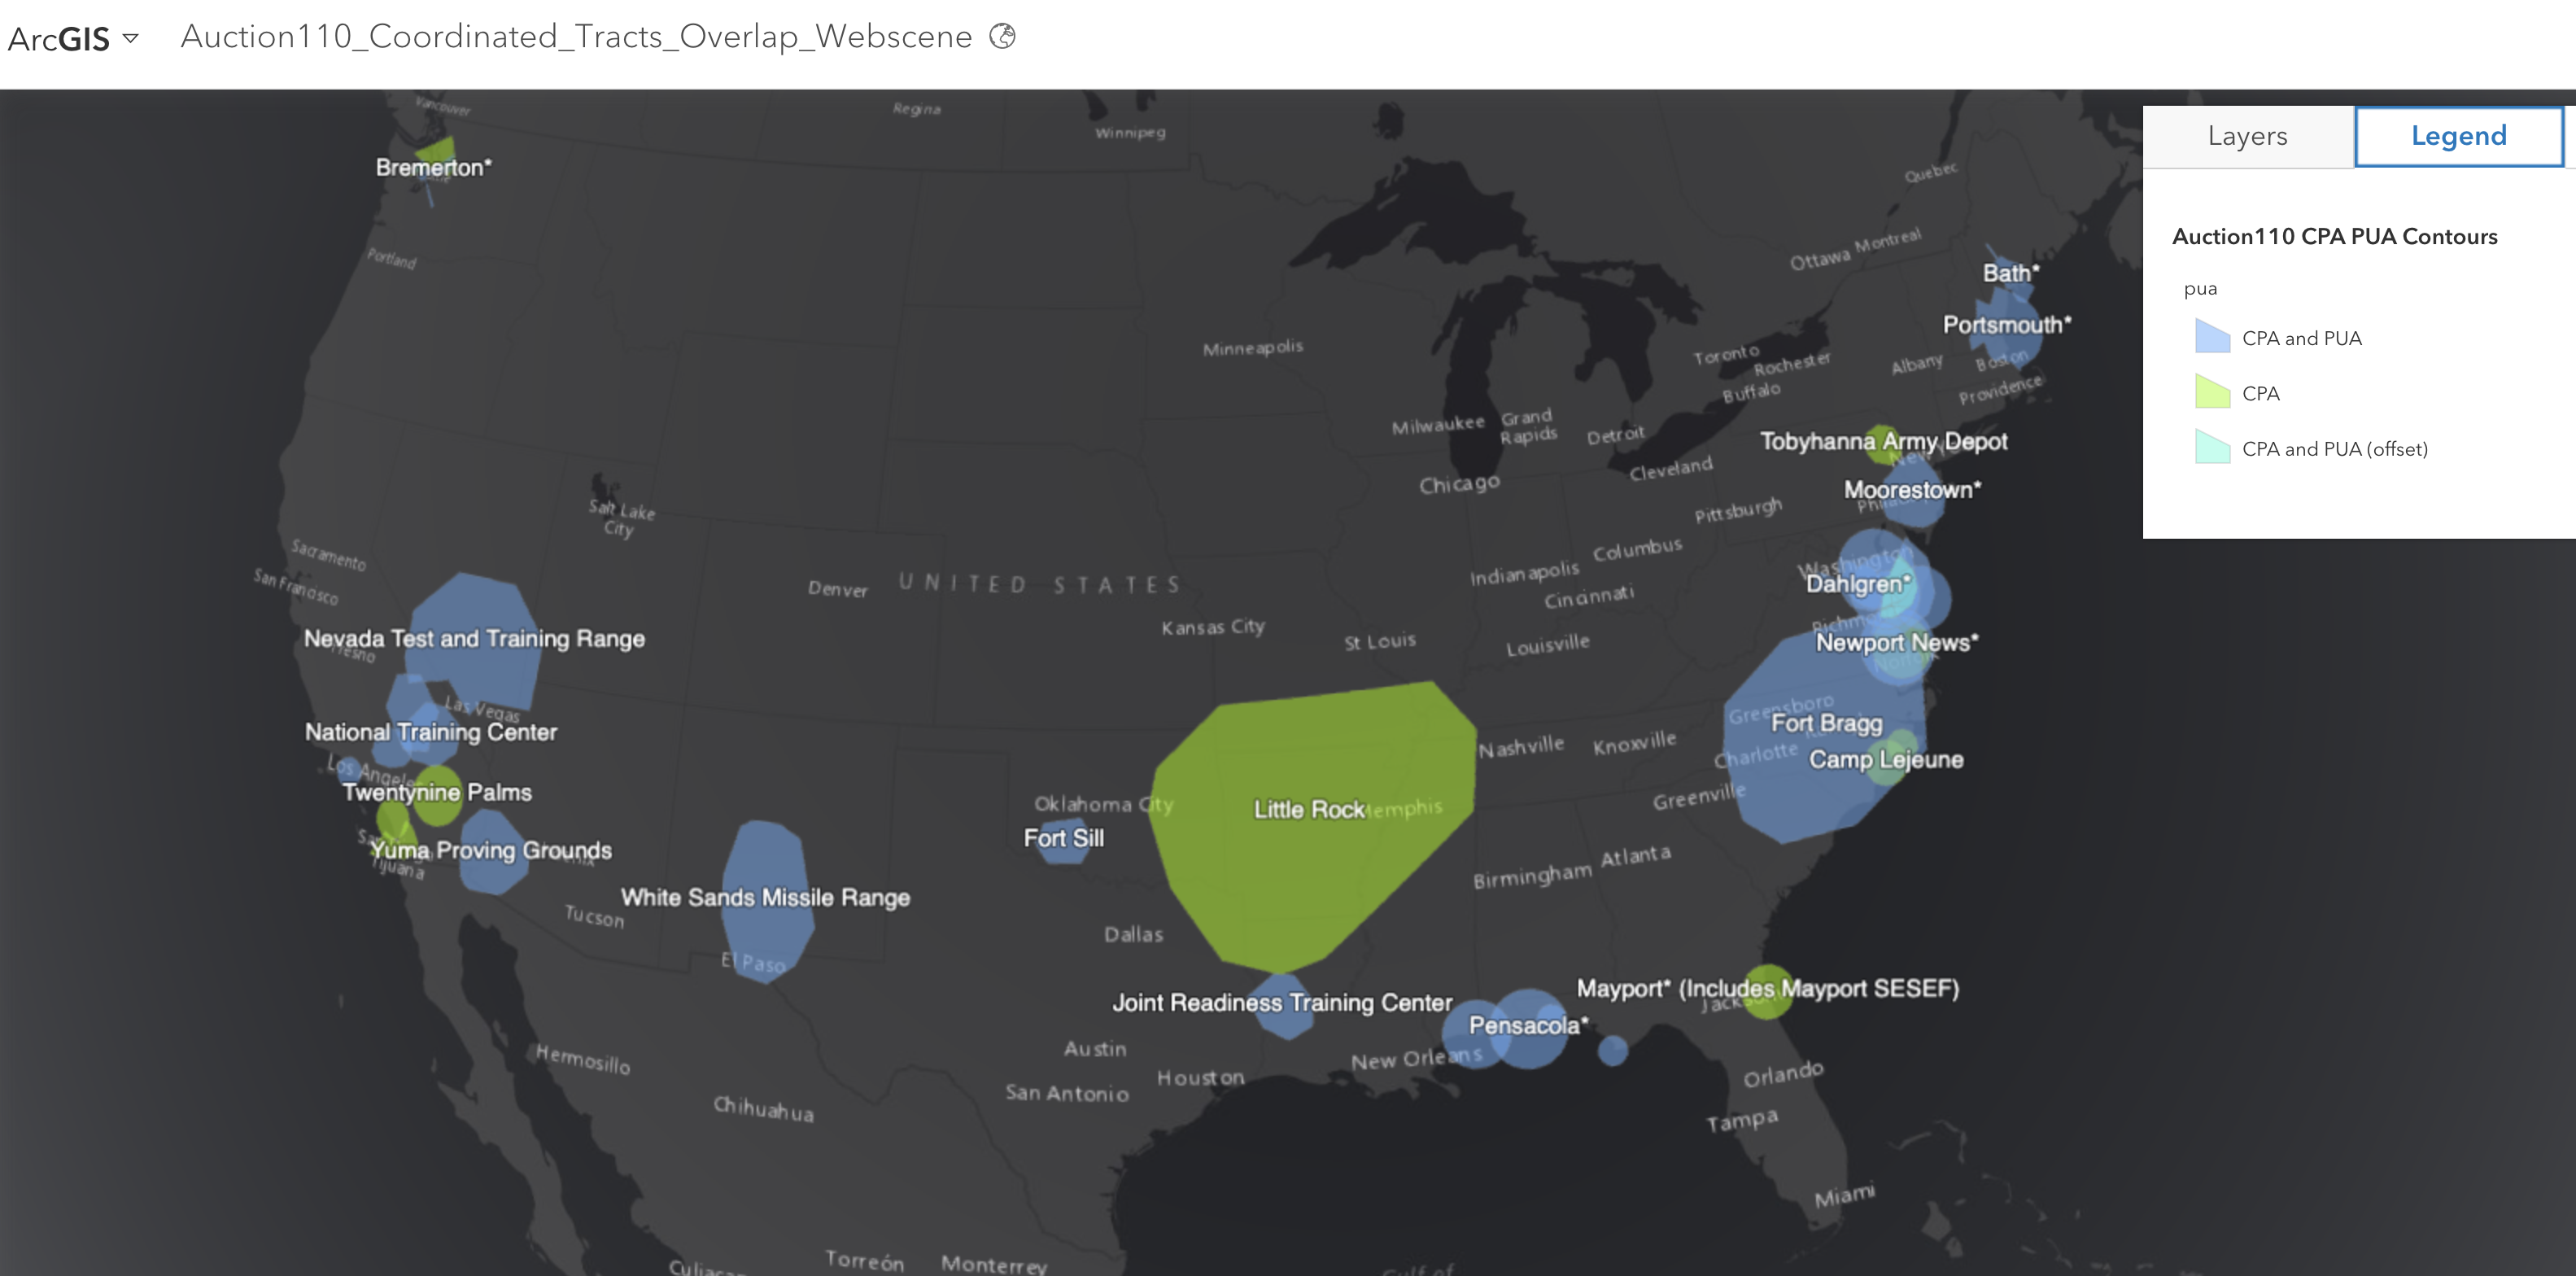
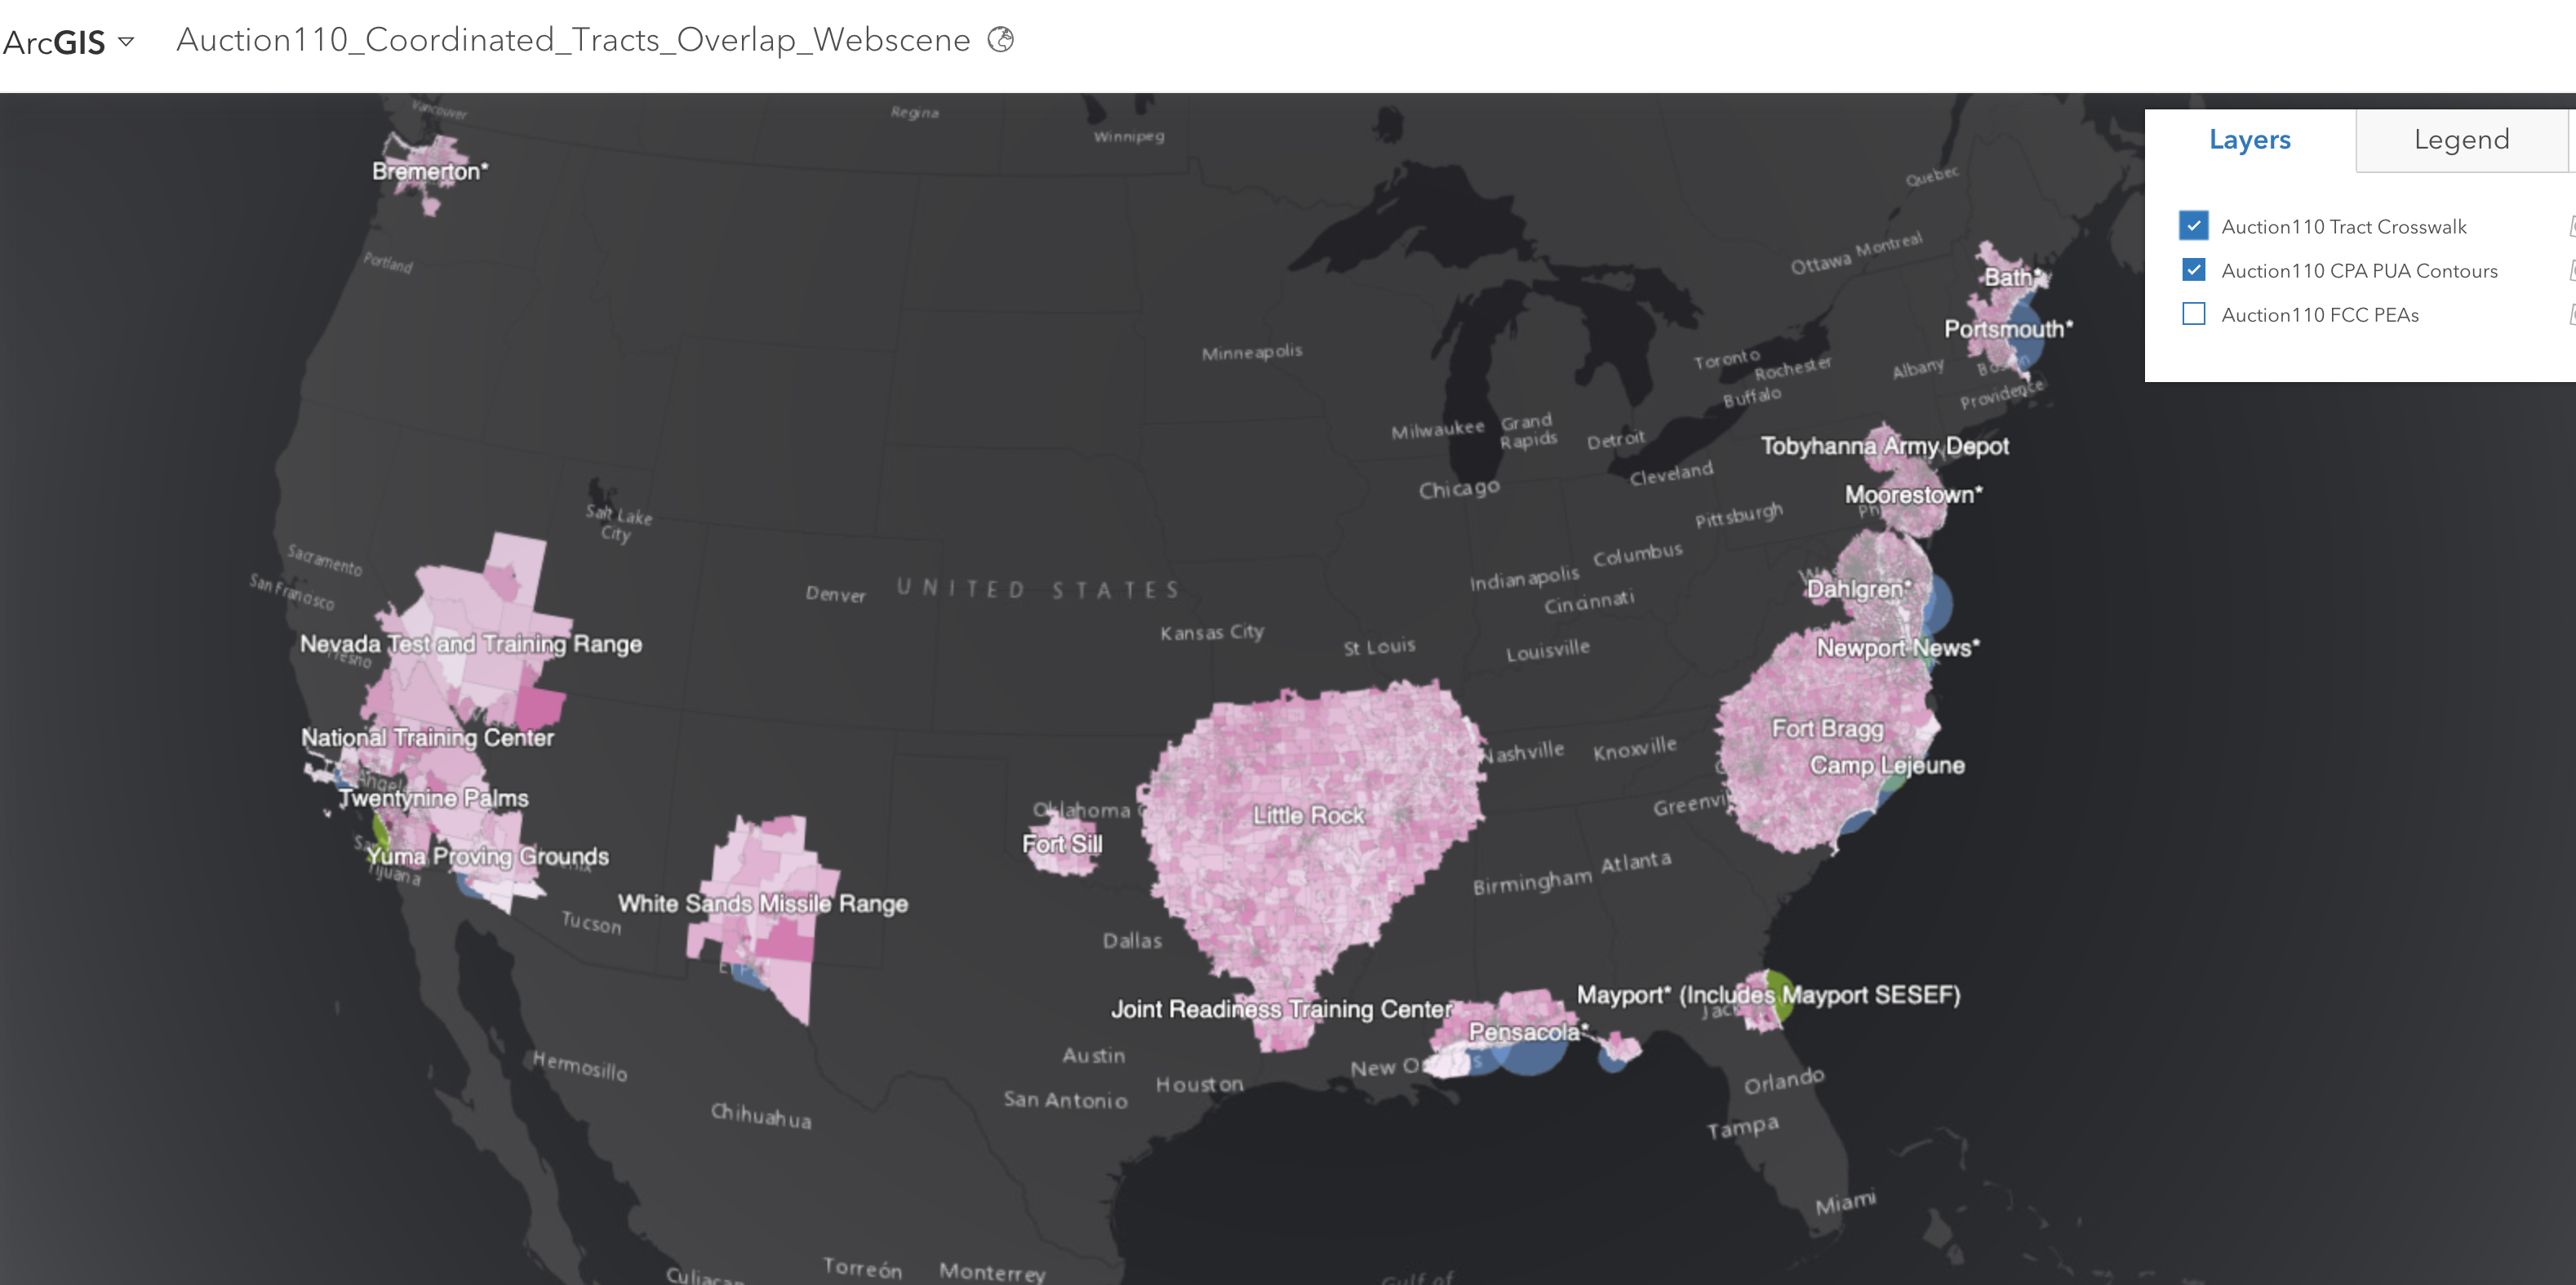
Before a licensee commences operations in a Cooperative Planning Area (CPA) or Periodic Use Area (PUA), it must first successfully coordinate with the federal incumbent(s) associated with that area. The image below to the left illustrates the geographic boundaries for each of the coordination areas. Green indicates CPAs only, blue indicates CPAs & PUAs that completely overlap, and turquoise blue indicates the CPA and PUA which only partially overlap (Naval Air Station, Patuxent River). The image below to the right shows which census tracts (based on 2010 US Census) overlap with these coordination areas.
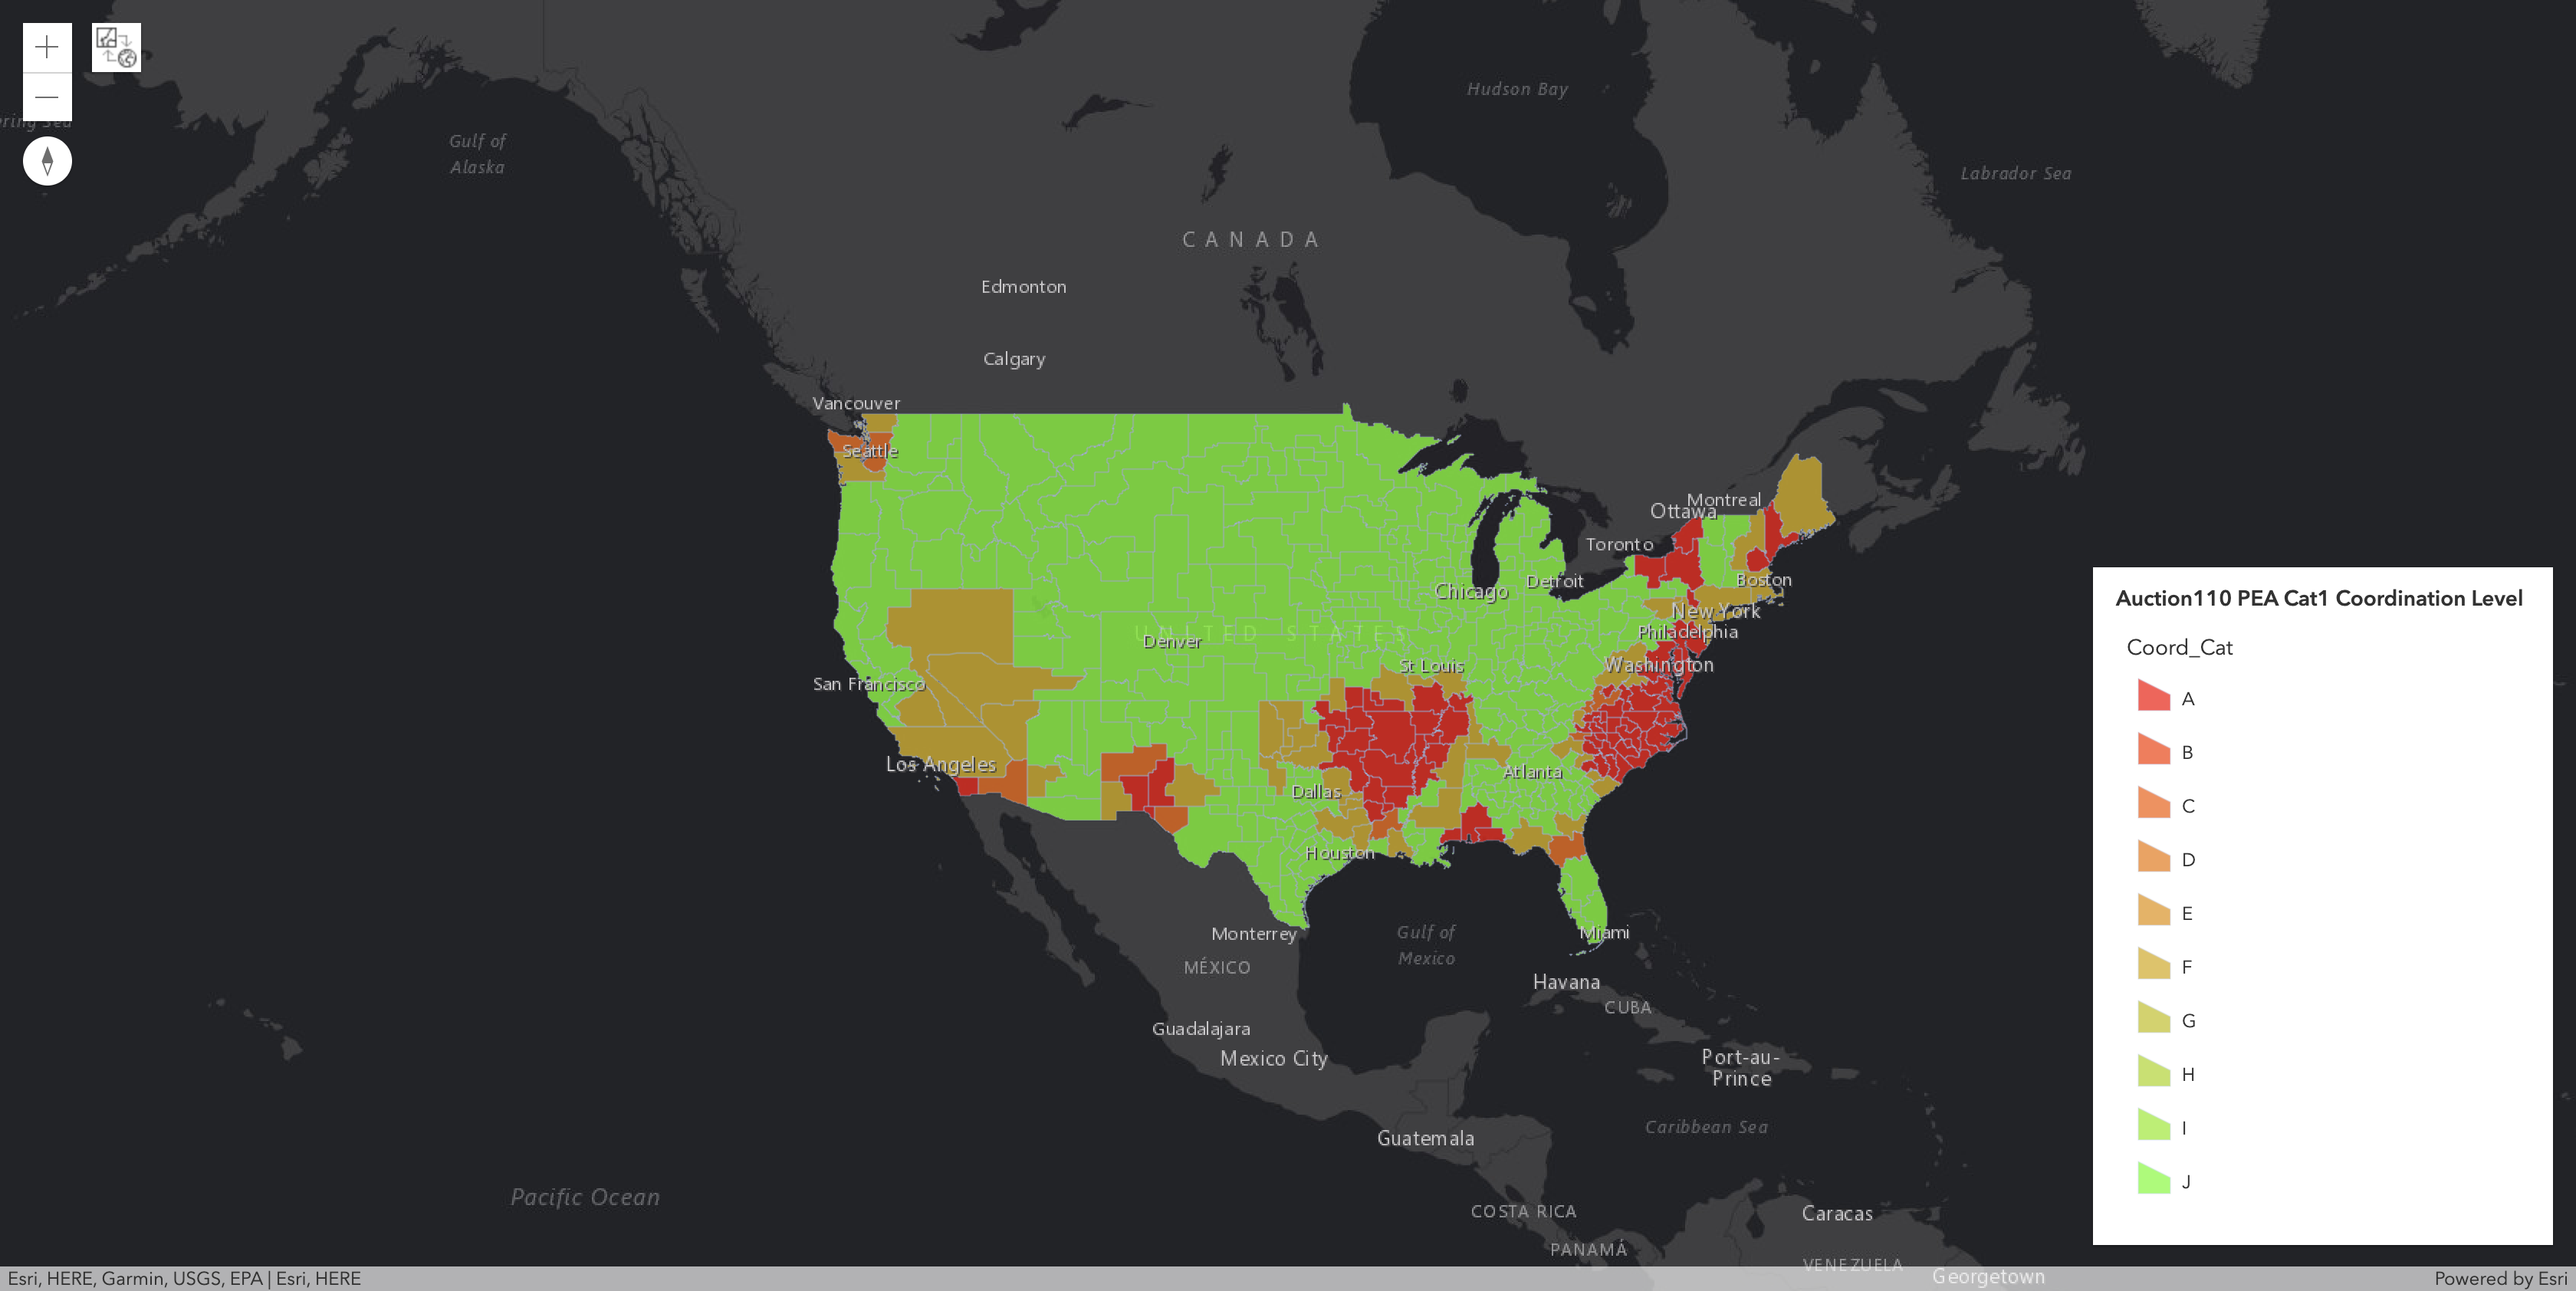
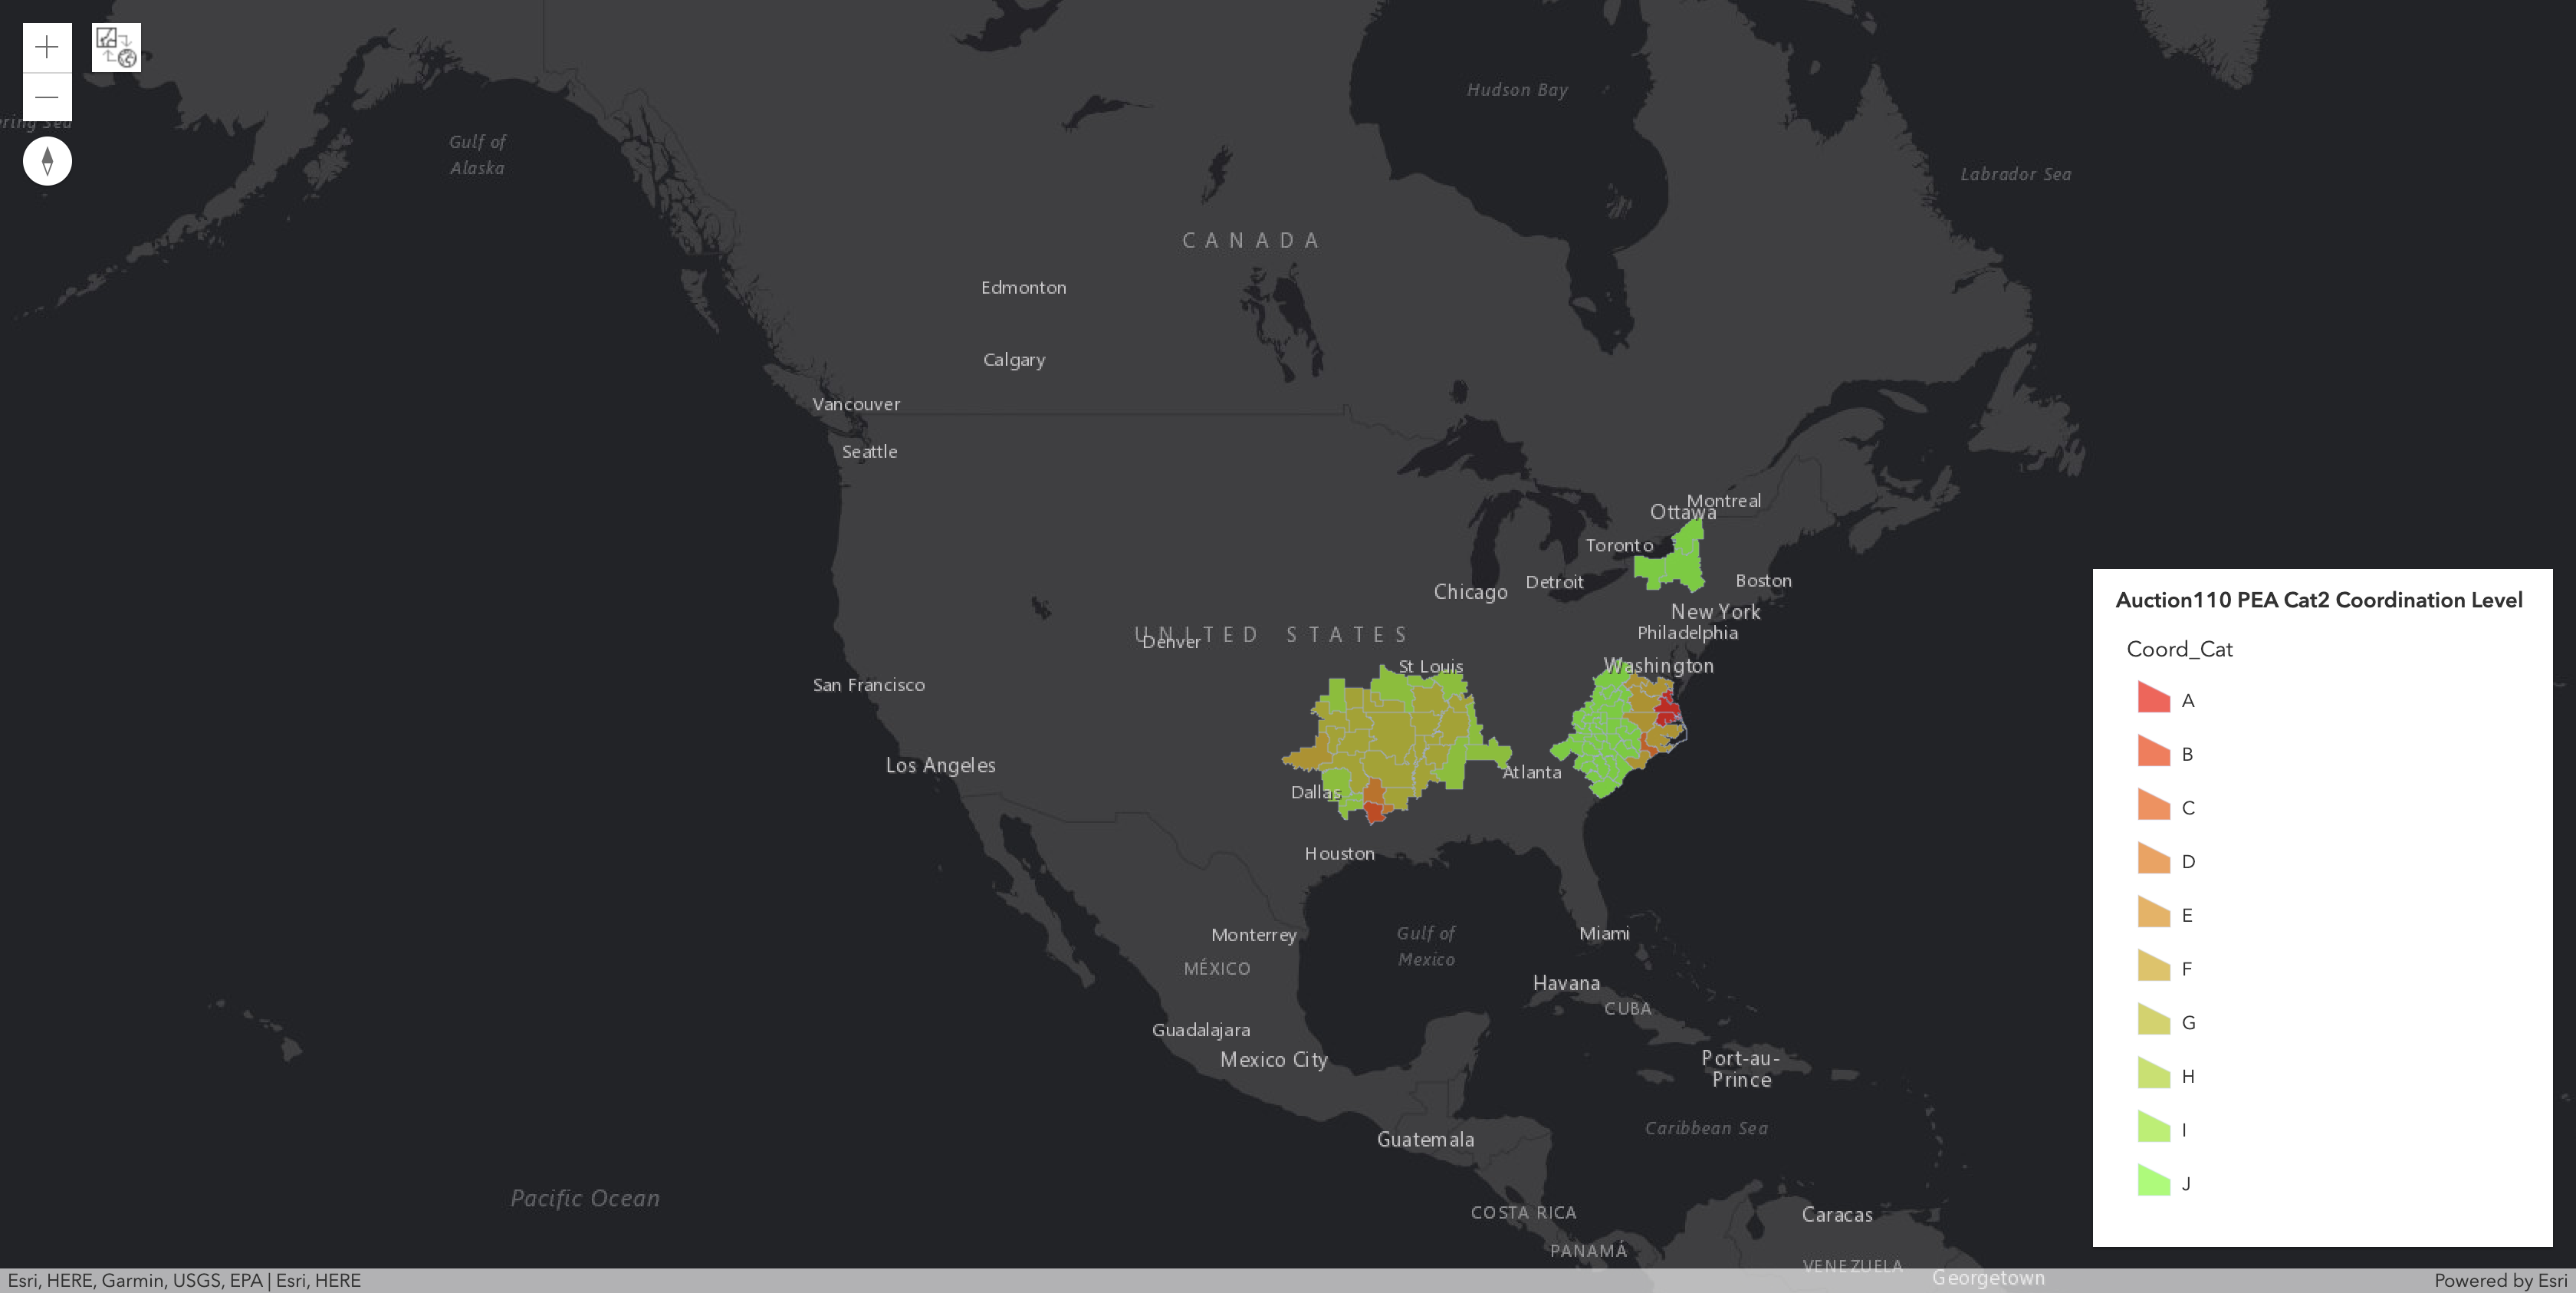
In general, if all 10 blocks in a PEA are Category 1 licenses, they are subject to the same coordination requirements. In those markets where there are both Category 1 and Category 2 licenses, it is because the PEAs intersect with one of the special cases (e.g., Little Rock CPA, Fort Bragg CPA and PUA, Syracuse, Rochester and Watertown) and therefore have different rules depending on the block. In addition, because each license overlaps with CPAs and PUAs at varying percentages of their populations, the coordination requirements are not equal even within a particular category of licenses. Therefore I have developed a new classification scheme to help bidders better understand these restrictions on each product based on the percentage of the PEA's population that requires coordination at the close of the auction (Year 0) and after one year (Year 1) (as a percent of their 2010 US Census population statistics, which was also used by the DoD). More specifically, this classification scheme breaks down as follows:
The maps below show which blocks within each PEA fall into each coordination classification for both Category 1 and Category 2 licenses.
| Coordination Classification | Required Coordination at Year 1 | Required Coordination at Year 0 |
| A | >=75% | >=75% |
| B | >=50% & <75% | >=75% |
| C | >=50% & <75% | >=50% & <75% |
| D | >0% & <50% | >=75% |
| E | >0% & <50% | >=50% & <75% |
| F | >0% & <50% | >0% & <50% |
| G | 0% | >=75% |
| H | 0% | >=50% & <75% |
| I | 0% | >0% & <50% |
| J | 0% | 0% |
The maps below show which blocks within each PEA fall into each coordination classification for both Category 1 and Category 2 licenses.
Coordination Classifications for Category 1 Licenses:

Coordination Classifications for Category 2 Licenses:

The defined CPAs and PUAs result in
29.8
percent of Licenses and roughly
18
percent of MHz-POPs requiring coordination after the close of the auction (and dropping to roughly
16
percent of MHz-POPs one year after the close of the auction)(10). However, it should also be noted that these coordination zones are based on conservative assumption of 100 meter tower heights which likely overstates the actual impact on wireless operations.
Tracking Auction 110's Progress Toward Completion after Round 151
Comparing Auction 110's Progress to Prior FCC Auctions after Round 151
Please Select a Round to Display Network Graph
BONUS VIDEO: Review Round-by-Round Bidding with Video Showing Change in Demand for Round 1 through Round 151:
(10) Using 2020 Census data, those population percentages are basically the same.
Nationwide Gross Proceeds by Coordination Classification at End of Round
151:
| Coordination Classification | Gross Proceeds |
|---|---|
| A | $726,052,300 |
| B | $462,000 |
| C | $313,609,260 |
| D | $8,472,000 |
| E | Not Applicable |
| F | $6,897,758,164 |
| G | $325,733,052 |
| H | Not Applicable |
| I | $83,412,612 |
| J | $13,532,508,406 |
Nationwide Price Per MHz-POP Statistics by Coordination Classification at End of Round
151:
| Coordination Classification | Price Per MHz-POP |
|---|---|
| A | $0.201184 |
| B | $0.077351 |
| C | $0.446379 |
| D | $0.286868 |
| E | Not Applicable |
| F | $0.939779 |
| G | $0.648780 |
| H | Not Applicable |
| I | $0.356669 |
| J | $0.745076 |
Additional Round-by-Round Analysis
3D Map of Gross Proceeds by Category in Each PEA after Round
151
Treemap of Gross Proceeds in Each PEA after Round
151 (sum across all categories)
Demand Analysis
Excess or Net Demand (Demand-Supply) in Each PEA after Round
151:
(across all categories in each PEA)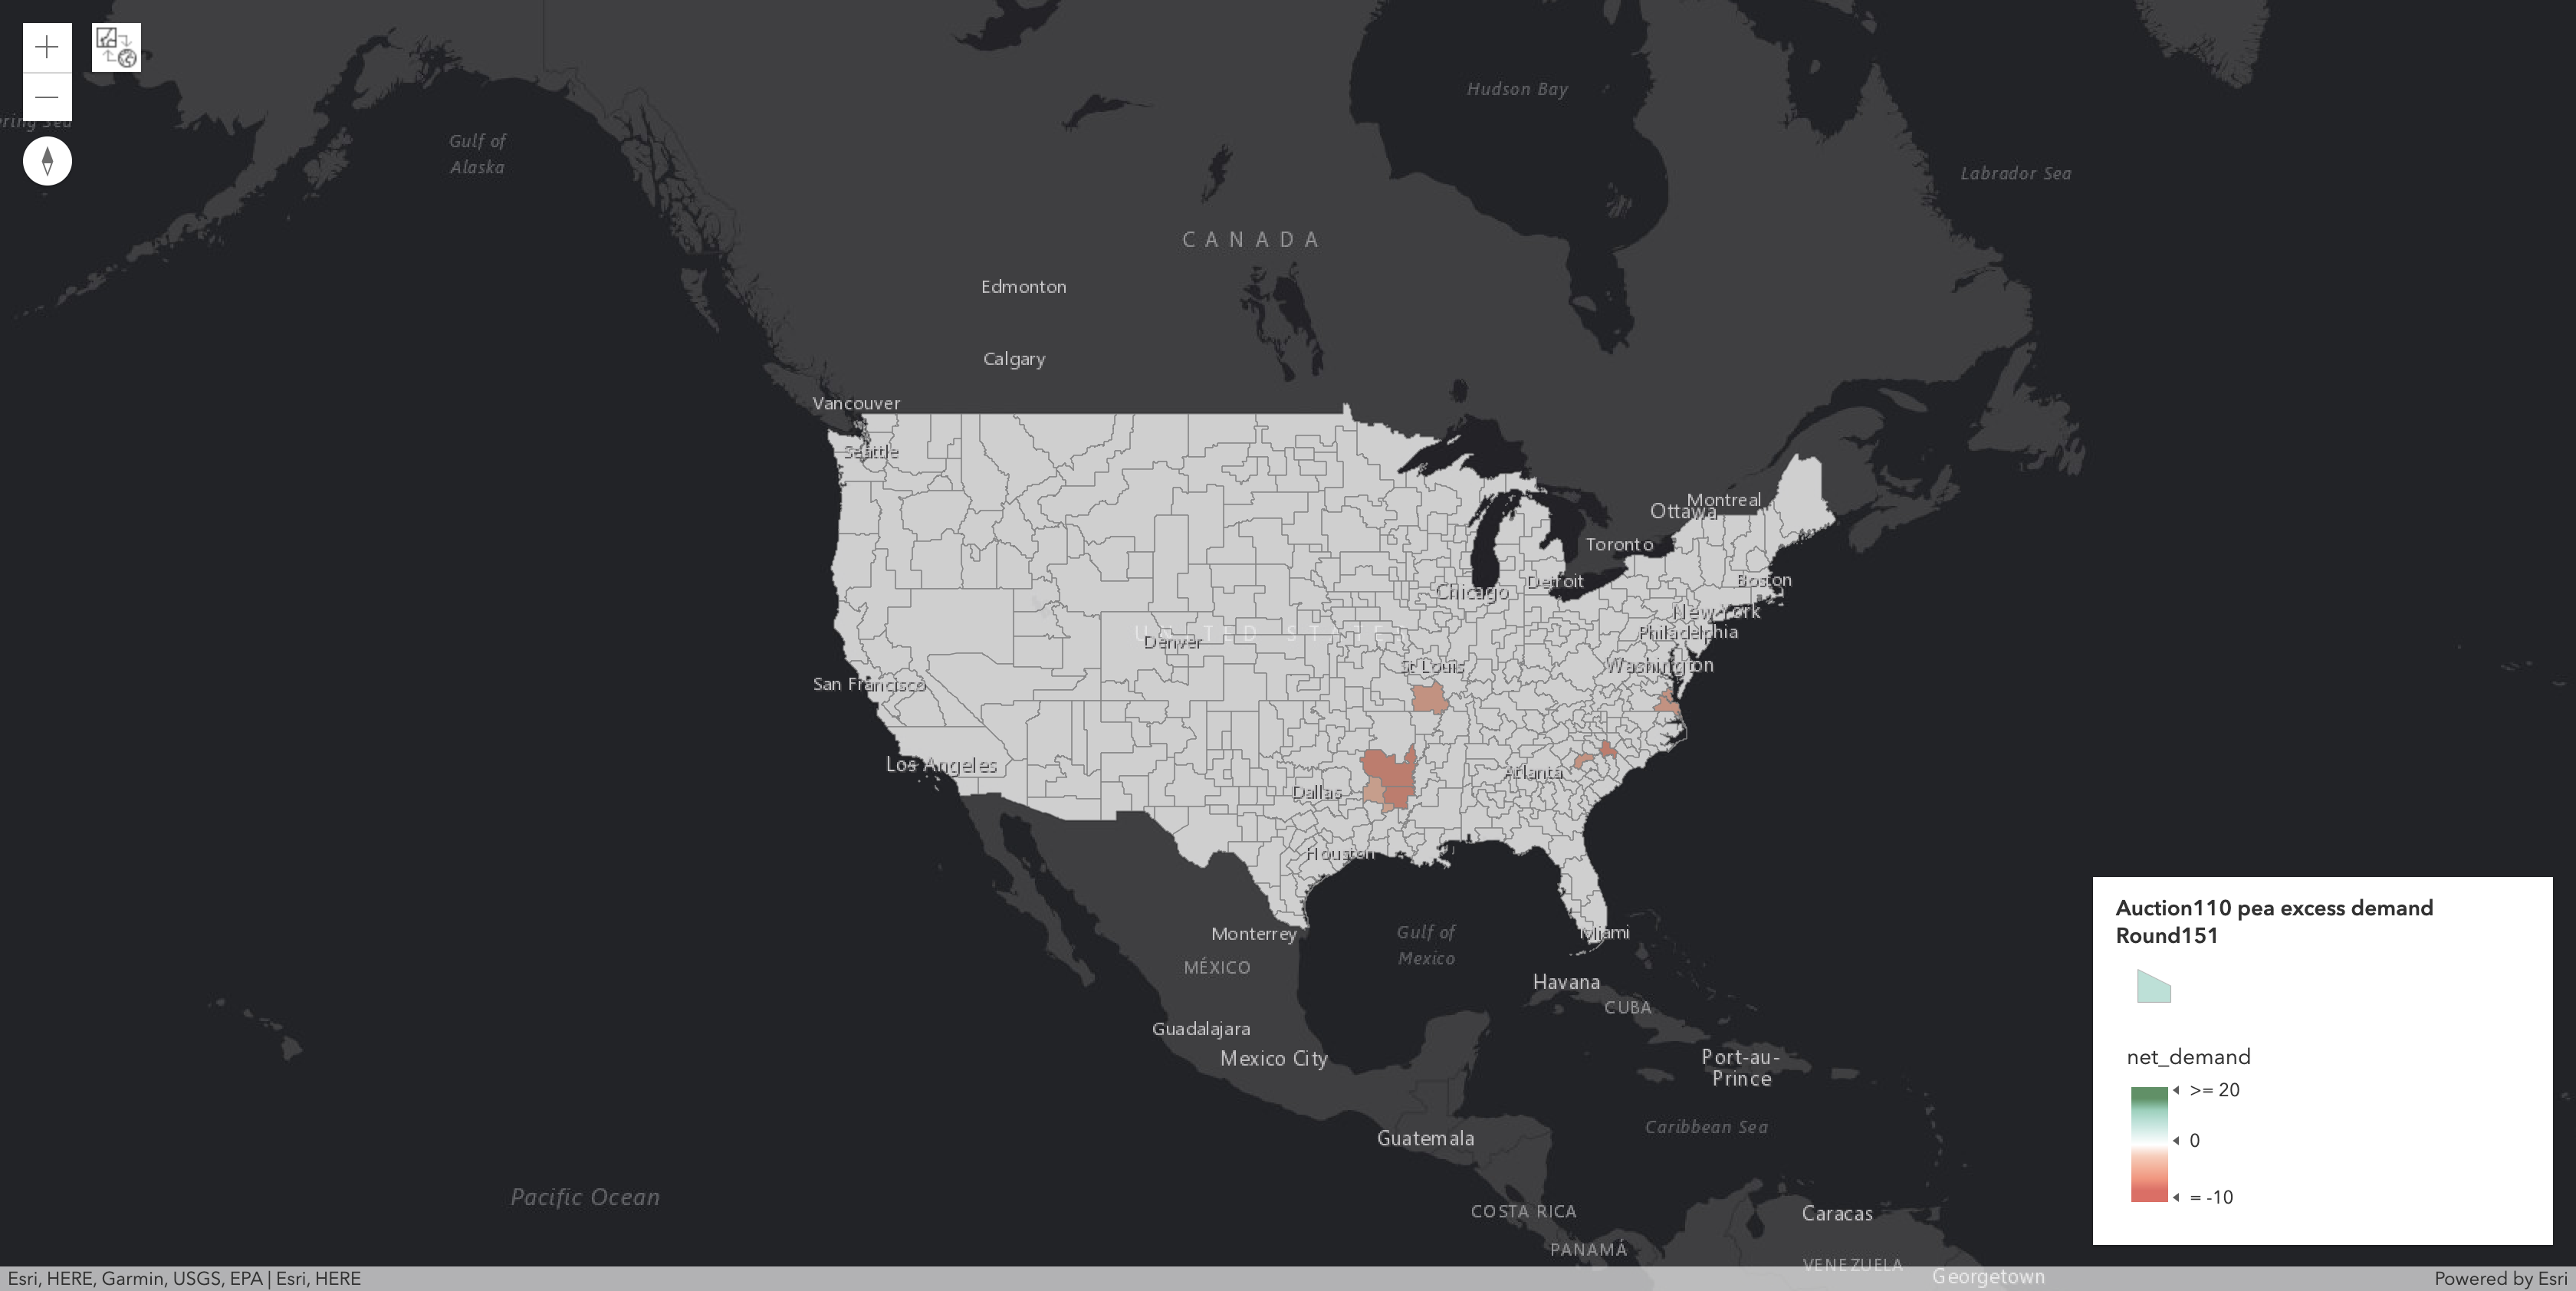
(across all categories in each PEA)

Change in Demand in Round
151 from Prior Round in Each PEA:
(across all categories in each PEA)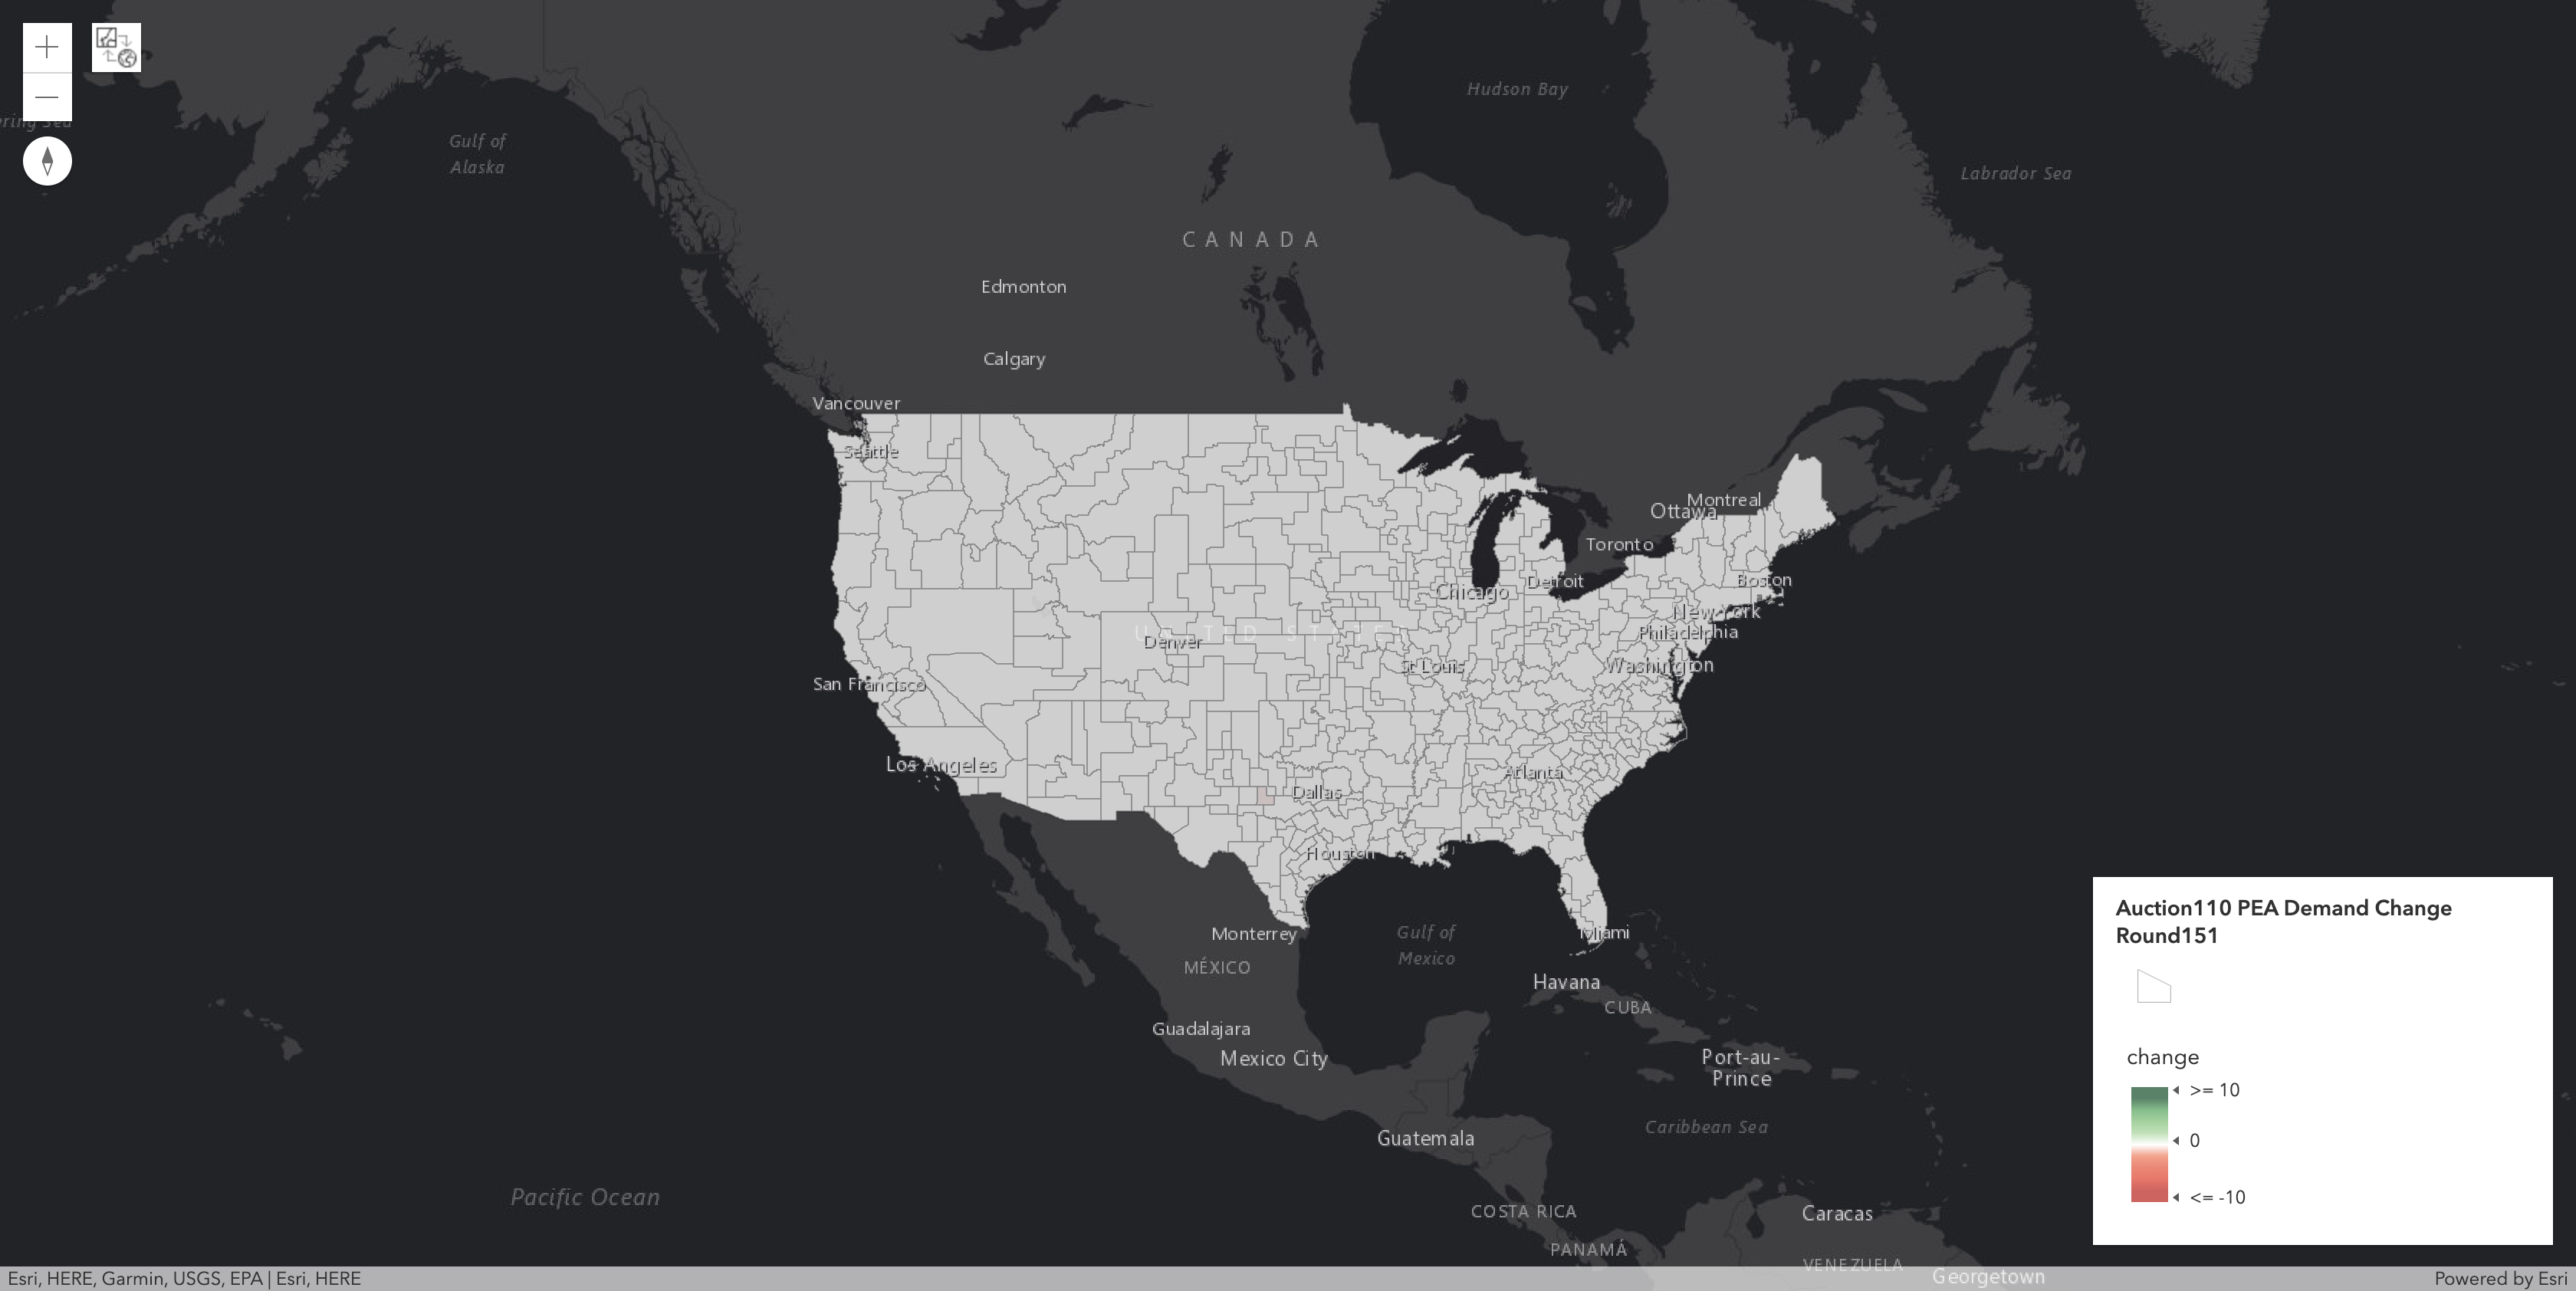
(across all categories in each PEA)

20 PEAs with the Largest Excess Demand after Round
151:
(across all categories in each PEA)
(across all categories in each PEA)
| market_number | market_name | aggregate_demand | supply | excess_demand |
|---|
20 PEAs with Largest Absolute Change in Demand after Round
151
from Prior Round:
(across all categories in each PEA)
from Prior Round:
(across all categories in each PEA)
| market_number | market_name | aggregate_demand | demand_change |
|---|---|---|---|
| PEA288 | Abilene, TX | 10 | -1 |
Change in Aggregate Demand for All PEAs by Round: (across all categories in each PEA)
(Double click on legend to switch to a different PEA)
(Double click on legend to switch to a different PEA)
20 PEAs with Largest Absolute Change in Demand in Category 1 after Round
151 from Prior Round:
| market_number | market_name | category | aggregate_demand | demand_change |
|---|---|---|---|---|
| PEA288 | Abilene, TX | Cat1 | 10 | -1 |
20 PEAs with Largest Absolute Change in Demand in Category 2 after Round
151 from Prior Round:
| market_number | market_name | category | aggregate_demand | demand_change |
|---|
Tracking Auction 110's Progress Toward Completion after Round 151
NOTE: Because the prior nonlogarithmic chart is somewhat skewed by the large excess demand in the early rounds, we have repeated the chart above taking the log (base 10) of the values on both axeses:
NOTE: This next chart looks at changes in excess demand in dollars after removing the impact of round price increases. Please note negative scale. Also, this chart is not relevant for Round 1 because there are no prior rounds.
Comparing Auction 110's Progress to Prior FCC Auctions after Round 151
The chart below tracks auction progress (using the metric of excess demand as a percent of aggregate demand) against other recent prior FCC auctions.
NOTE: Any comparison between Auction 97 (the AWS-3 auction and an SMRA auction) and the other auctions shown (which are all clock auctions) needs several important caveats. SMRAs have a fundamentally different structures from clocks auctions (e.g., SMRAs allow bidders to bid for specific licenses whereas in clock auctions you bid for generic blocks; SMRAs determine provisional winners after reach round whereas clock auctions just determine aggregate demand at the end of each round). Participants in an SMRA also face different rules regarding the exiting of accepted bid (e.g., a provisionally winning bidder in an SMRA is allowed to submit a withdrawal bid subject to a withdrawal penalty whereas in a clock auction a bidder may not withdraw a bid once demand equals supply). Finally, in SMRAs, bidders do not need to affirmatively bid in every round for licenses that they have provisionally won as they will have an opportunity to bid again in the next round if their provisionally winning bid is outbid in the current round. These differences make any direct comparisons difficult. Nevertheless, with all these caveats in mind and using a simple moving average to “smooth” the variations in demand that you see from round-to-round in an SMRA, I thought that it might still be interesting to make a comparison between Auction 97 and this auction.
Also note that I have revised the line graph above for Auction 1002 to account for the fact that there were both stages and rounds. The change I made should make for better comparisons.
Fun: Comparing Current PEA Prices to Predicted Prices Based on Prior FCC Auctions after Round
151
Deals Following Round 151: Most Underpriced PEAs (Above 1 Million in Population) Relative to their Predicted Price(12):
In the bubble graph below, we attempt to track how current PEA prices (on a price per MHz pop basis) compare to their "Predicted Price" based on past FCC auctions. To accomplish this comparison, we need to introduce the concept of the "Overprice Ratio". This Overprice Ratio is the current price of each PEA divided by the Predicted Price for that PEA.
This Predicted Price for any PEA is calculated by first classifying each PEA into its relevant REAG (an FCC licensing schema that divides the country into 6 regions) and then identifying a "Reference Market" for that REAG. Typically, the Reference Market for each REAG is the largest PEA by population (with the exception of the Southeast REAG where we selected Atlanta as its Reference Market rather than Washington DC, which we have reclassified as being in the Northeast REAG). For those PEAs that are Reference Markets, we use the New York PEA (the "Nationwide Reference Market") as their Reference Market. We then take the current price for each Reference Market and multiply it by the historical ratio of auction prices between each PEA and its Reference Market to get the Predicted Price.
The y-axis on the left shows the log (base 10) of the "Overprice Ratio." We take the log of the Overprice Ratio to lessen the impact of outliers. By definition, the New York PEA (shown in the graph as the biggest bubble in dark blue below), as the Nationwide Reference Market, will always remain at y=0 (the horizontal green line in the graph below).
In addition, the x-axis shows aggregate demand in each PEA after the latest round. There is a vertical green line where aggregate demand equals 14. This the maximum number of licenses available for sale in eac PEA. Thus, if the bubble shows up to the right of this green vertical line, aggregate demand in this PEA is greater than supply. Also, the y-axis on the right side of the graph tracks the current price for New York PEA after the latest round and is adjusted so that New York PEA's price always remains on the green horizontal line in the graph below. Finally, the bubbles representing the PEAs are sized based on population and color-coded based on the PEA that they fall in.
Example:
Pick San Diego. Its Reference Market is Los Angeles.
Suppose
San Diego current aggregate demand = 10
San Diego current price (average across categories) = $0.50
Los Angeles current price (average across categories) = $0.75
Historical ratio (San Diego/Los Angeles) = 1.09784
Compute
San Diego current Predicted Price = $0.75 * 1.09784 = $0.82338
San Diego Overprice Ratio = $0.50 / $0.82338 = 0.607253
San Diego logarithmic-scaled Overprice Ratio = Log10(0.607253) = -0.21663
Interpretation
In the logarithmic-scaled chart below, San Diego would be represented by a bubble with coordinates (x,y) = (10,-0.21663). That means San Diego is underpriced. All bubbles with negative values are underpriced; conversely, all bubbles with positive values are overpriced with respect to their Reference Market's current price. Before the Reference Market's price converges, any underpriced PEA is a valid prediction due to the non-decreasing price property; however, the converse may not be true until the Reference Market's price converges.
To get the complete list of Reference Markets, Predicted Prices and Overprice Ratios for any PEA see the Table below.(11)
(11) NOTE: Starting in Round 53, I removed a weighting based on coordination levels that factored into our "deals" criteria. The removal of this factor should make deals more transparent to users, but also requires awareness of these coordination requirement restrictions.
Deals Following Round 151: Most Underpriced PEAs (Above 1 Million in Population) Relative to their Predicted Price(12):
| Market Number | Market Name | Population | Aggregate Demand | Supply | Bidding Units | Ave. Current Price MHz Pop (for PEA) | Reference Market | Reference Market Name | Predicted Price (for PEA) | Overprice Ratio (Log Base 10) |
|---|---|---|---|---|---|---|---|---|---|---|
| PEA033 | Virginia Beach, VA | 1,698,835 | 8 | 10 | 1,700 | $0.037530 | PEA011 | Atlanta, GA | $1.168173 | -1.493127 |
| PEA018 | San Diego, CA | 3,095,313 | 10 | 10 | 3,100 | $0.138370 | PEA002 | Los Angeles, CA | $1.534094 | -1.044809 |
| PEA029 | Jacksonville, FL | 1,918,264 | 10 | 10 | 1,920 | $0.270244 | PEA011 | Atlanta, GA | $0.982441 | -0.560550 |
| PEA006 | Philadelphia, PA | 7,587,252 | 10 | 10 | 7,590 | $0.269149 | PEA001 | New York, NY | $0.756242 | -0.448668 |
| PEA047 | Brownsville, TX | 1,264,091 | 10 | 10 | 1,260 | $0.479871 | PEA008 | Dallas, TX | $1.276182 | -0.424789 |
| PEA005 | Baltimore, MD-Washington, DC | 7,842,134 | 10 | 10 | 7,840 | $0.433479 | PEA001 | New York, NY | $0.979770 | -0.354156 |
| PEA048 | Harrisburg, PA | 1,244,058 | 10 | 10 | 1,240 | $0.438163 | PEA001 | New York, NY | $0.835463 | -0.280292 |
| PEA034 | Fresno, CA | 1,676,476 | 10 | 10 | 1,680 | $0.528490 | PEA002 | Los Angeles, CA | $0.992846 | -0.273846 |
| PEA057 | Richmond, VA | 1,080,661 | 10 | 10 | 1,080 | $0.232598 | PEA011 | Atlanta, GA | $0.429268 | -0.266122 |
| PEA049 | Albany, NY | 1,222,542 | 10 | 10 | 1,220 | $0.247026 | PEA001 | New York, NY | $0.446544 | -0.257121 |
| PEA039 | Oklahoma City, OK | 1,446,527 | 10 | 10 | 1,450 | $0.850935 | PEA008 | Dallas, TX | $1.466663 | -0.236434 |
| PEA031 | Indianapolis, IN | 1,769,011 | 10 | 10 | 1,770 | $0.773257 | PEA003 | Chicago, IL | $1.297989 | -0.224947 |
| PEA016 | Seattle, WA | 3,792,218 | 10 | 10 | 3,790 | $0.635749 | PEA002 | Los Angeles, CA | $1.004098 | -0.198490 |
| PEA045 | Raleigh, NC | 1,302,381 | 10 | 10 | 1,300 | $0.837210 | PEA011 | Atlanta, GA | $1.230934 | -0.167401 |
| PEA043 | Charlotte, NC | 1,327,006 | 10 | 10 | 1,330 | $0.835268 | PEA011 | Atlanta, GA | $1.207056 | -0.159901 |
| PEA041 | Syracuse, NY | 1,371,959 | 10 | 10 | 1,370 | $0.431194 | PEA001 | New York, NY | $0.621424 | -0.158716 |
| PEA040 | Birmingham, AL | 1,399,686 | 10 | 10 | 1,400 | $0.850834 | PEA011 | Atlanta, GA | $1.216607 | -0.155306 |
| PEA060 | Manchester, NH | 1,025,620 | 10 | 10 | 1,030 | $0.243267 | PEA001 | New York, NY | $0.345623 | -0.152518 |
| PEA059 | Memphis, TN | 1,039,627 | 10 | 10 | 1,040 | $0.312227 | PEA030 | Kansas City, MO | $0.416988 | -0.125653 |
| PEA044 | Rochester, NY | 1,316,146 | 10 | 10 | 1,320 | $0.499671 | PEA001 | New York, NY | $0.655170 | -0.117670 |
(12) NOTE: Starting in Round 53, I removed a weighting based on coordination levels that factored into our "deals" criteria. The removal of this factor should make deals more transparent to users, but also requires awareness of these coordination requirement restrictions.
BETA: Probability of Getting Stuck in Any Product by Round
(Double click on legend to switch to a different product)
In the chart below, we are experimenting with an "early warning" system for bidders that will help them assess the probability of getting stuck in the next round because demand will fall below supply. The hope that this system will provide bidders with an earlier warning than simply looking at the excess demand. The y-axis in the chart shows "Probability of Getting Stuck." This y-value is really a binomial probability distribution which we think can be used to approximate a stochastic model of bidders in decision making to reduce, maintain, and increase demand on a category. The closer y-values approach 1, the more likely that a bidder could become stuck in that product.
To calculate this binomial probability, we use the general binomial probability formula:
Formula: p(k=t) = C(n,t) * pt * (1-p)(n-t), where C(n,t) = n!/[t! * (n-t)!]
and where:
There are a few assumptions one has to make for this probability to be valid:
To calculate this binomial probability, we use the general binomial probability formula:
Formula: p(k=t) = C(n,t) * pt * (1-p)(n-t), where C(n,t) = n!/[t! * (n-t)!]
and where:
- p is the probability of a bidder to reduce demand given n and supply
- n represents aggregate demand
- t represents aggregate number of reduce demand blocks
- p(k=t) is the probability of having reduce demand as many as t blocks
There are a few assumptions one has to make for this probability to be valid:
- Each block of excess demand will represent a bidder. (Since we lack information on bidder's requested demand, we have no choice but to make this assumption).
- Every bidder is identical and independent.
- Perhaps, most debatable, that p is equal to 50%. This means that a bidder's likelihood to reduce its demand stays consistent throughout the auction. But in the abscence of better information about bidders, this might be the fairest assumption.
(Double click on legend to switch to a different product)
BETA: Network Graph for Selected Round
The image below shows the last round with a network graph (which may not be all rounds).
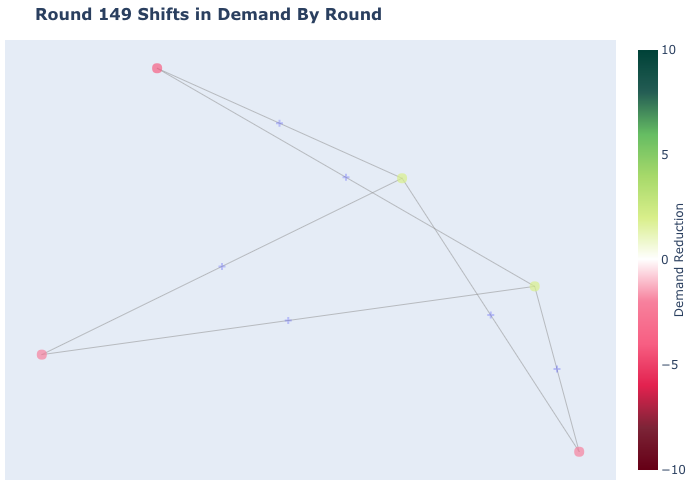
Please use the dropdown to generate the network graph for prior rounds. As not every round had aggregate demand for one PEA decrease and aggregate demand in another PEA increase, not all rounds are available to be selected.
Network Graphs show interconnections between a set of entities. In the network graph below, I show the interconnections between PEAs in each round. These interconnections are repsented by "nodes" and "edges."
Each node in the graph represents a PEA. Each node is color coded based on whether aggregate demand increased or reduced demand in the PEA in the round and each node is also sized according to population. You can hover over each node to get information about this PEA including the number of connections to that node and the demand change in the PEA in the round.
An edge (or line between nodes) in the graph means that aggregate demand (across all bidders) shifted from one PEA and moved into one or more new PEAs in the same round. While you cannot say definitively that a bidder moved its demand from one particular PEA to another specific PEA if there is more than one PEA with shifting demand in the same round, an edge does indicate that bidders in aggregate decided to reduce demand in a PEA (node) at one end of the edge and increased their demand in a PEA (node) at the other end of the edge in the same round. Because there can be a lot of edges in a round, you may have to zoom in the graph to better follow these edges. I have also inserted small light blue markers (in the shape of a cross) in the middle of each edge which reveals which nodes are connected by the edge highlighted.
The image below shows the last round with a network graph (which may not be all rounds).

Please use the dropdown to generate the network graph for prior rounds. As not every round had aggregate demand for one PEA decrease and aggregate demand in another PEA increase, not all rounds are available to be selected.
Select Round Number
Please Select a Round to Display Network Graph
BONUS VIDEO: Review Round-by-Round Bidding with Video Showing Change in Demand for Round 1 through Round 151:
Download to Excel or View Details on All PEAs After Round
151
Selected PEA Details(13)
(13) Calculations in the table below are based on 2010 Census figures unless designated with a "2020" in the column title.
| Market Number | Market Name | Category | Population | Population 2020 | Bidding Units | Supply | Aggregate Demand | Excess Demand | Demand Change | Coord % Year 0 | Coord % Year 1 | Coord Class | Posted Price | Gross Proceeds | Price Per MHz POP (for product) | Price Per MHz POP 2020 (for product) | Price Per MHz POP (for PEA) | Reference Market Number | Reference Market Name | Predicted Price (for PEA) | Overprice Ratio (Log Base10) |
|---|
